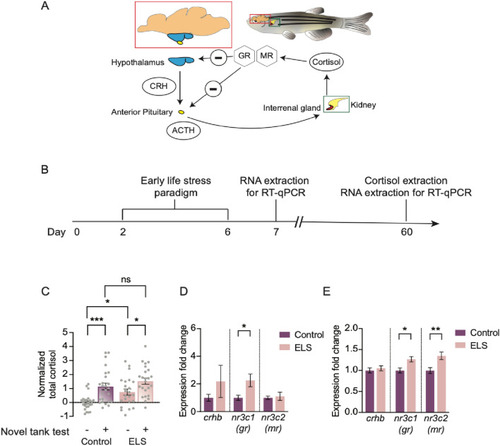
HPI axis is impacted in ELS. (A) The HPI axis, the main stress pathway, and its main genes and effectors. Brain of zebrafish is shown in the red bounding box. Within, the hypothalamus (in blue) and the anterior pituitary (in yellow) is shown. During stress, the hypothalamus signals to the anterior pituitary via CRH, and the anterior pituitary signals to the interrenal gland (shaded in red within the head kidney enclosed in the green bounding box) via ACTH. Cortisol is released from the interrenal gland and binds to GR and MR to negatively regulate its release. (B) Timeline of ELS and experiments performed. (C) Basal cortisol levels (−) were increased in ELS animals (n = 23) compared to controls (n = 25) (One-way ANOVA followed by Sidak’s multiple comparisons post-hoc test, p = 0.044). Elevated cortisol in response to stress (+), after the novel tank test, remain intact in control (n = 25, One-way ANOVA followed by Sidak’s multiple comparisons posthoc test, p = 0.00040) and ELS adults (n = 24, One-way ANOVA followed by Sidak’s multiple comparisons post-hoc test, p = 0.034). Cortisol levels after stress were no different between controls and ELS animals (One-way ANOVA followed by Sidak’s multiple comparisons post-hoc test, p = 0.54). (D) Quantitative real-time PCR of 7 dpf control (n = 9) and ELS (n = 8) larvae revealed increased gene expression levels of gr in ELS animals (Unpaired t test, gr: p = 0.018). No significant differences were found in expression levels of crhb and mr (Unpaired t test, crhb: p = 0.31, mr: p = 0.74). (E) At 60 dpf, gene expression levels of gr and mr were increased in brains of ELS animals (Unpaired t test, gr: p = 0.0064, mr: p = 0.0023), and no difference in crhb expression levels (Unpaired t test, p = 0.73) were observed, compared to controls. N = 9 per group. Error bars show ± standard error of the mean. Asterisks denote statistical significance (*p = 0.05, **p = 0.005, ***p = 0.0005). ns denotes no significance.
|
