
- Title
-
Neurotrophins in Zebrafish Taste Buds
- Authors
- Gatta, C., Schiano, V., Attanasio, C., Lucini, C., Palladino, A.
- Source
- Full text @ Animals (Basel)

Taste bud. (A) Histological section of a single taste bud protruding from the pluristratified epithelium of the oropharyngeal cavity. Hematoxilin-eosin staining; (B) Schematic representation of the ultrastructural organization of fish taste buds (modified from Hansen et al. 2002). Abbreviations: Tb = taste bud; Mc = mucous cell; Dc = dark cell (green); Lc = light cell (red); Bmc = basal cell (pink); Mgc = marginal cell (blue). Scale bar = 20 µm. |
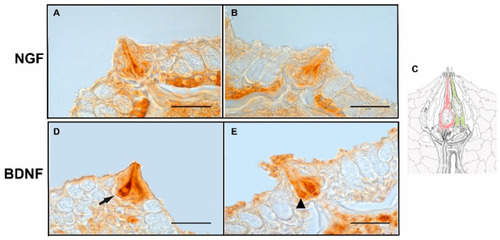
(A,B) NGF and (D,E) BDNF positive cells. (C) Taste bud scheme showing hypothetic congruence of positive cells with ultrastructural classification. The arrow indicates a putative light cell, while the arrowhead indicates a dark cell. Refer to color code in Figure 1 to recognize the cell type. Scale bar = 20 µm. |

(A,B) NT3 and (D,E) NT4 positive cells. (C,F) Taste bud scheme showing hypothetic congruence of positive cells with ultrastructural classification. The arrow indicates a putative light cell, while the arrowhead indicates a dark cell. Refer to color code in Figure 1 to recognize the cell type. Scale bar = 20 µm. |
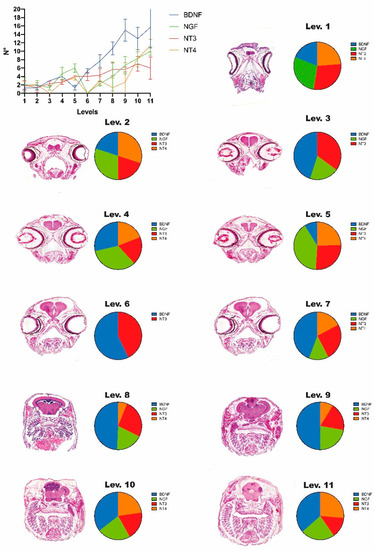
Distribution of NGF, BDNF, NT3 and NT4 positive cells in the oropharyngeal cavity. Diagram showing the number of positive cells for each transversal section of oropharynx. Level 1–Level 11: Diagrams showing the percentage of neurotrophin cells in the taste buds totally comprising the serial sections that compose the level. On the left of each diagram, the transversal sections of the zebrafish head (EE stain) representative of the level are reported (for details, see Materials and Methods section). |