
FIGURE
Fig. 4
- ID
- ZDB-FIG-220714-16
- Publication
- Gatta et al., 2022 - Neurotrophins in Zebrafish Taste Buds
- Other Figures
- All Figure Page
- Back to All Figure Page
Fig. 4
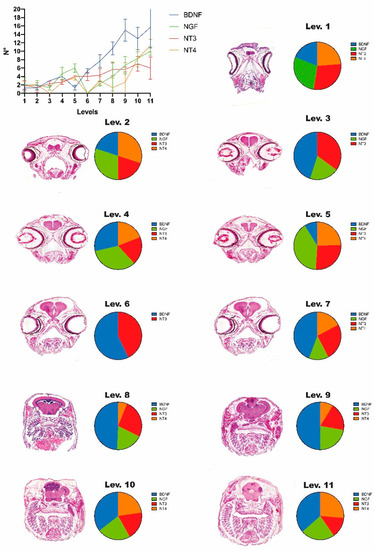
Distribution of NGF, BDNF, NT3 and NT4 positive cells in the oropharyngeal cavity. Diagram showing the number of positive cells for each transversal section of oropharynx. Level 1–Level 11: Diagrams showing the percentage of neurotrophin cells in the taste buds totally comprising the serial sections that compose the level. On the left of each diagram, the transversal sections of the zebrafish head (EE stain) representative of the level are reported (for details, see Materials and Methods section). |
Expression Data
Expression Detail
Antibody Labeling
Phenotype Data
Phenotype Detail
Acknowledgments
This image is the copyrighted work of the attributed author or publisher, and
ZFIN has permission only to display this image to its users.
Additional permissions should be obtained from the applicable author or publisher of the image.
Full text @ Animals (Basel)