
- Title
-
Protective Effect of Hedyotis diffusa Willd. Ethanol Extract on Isoniazid-Induced Liver Injury in the Zebrafish Model
- Authors
- Wang, X., Zhao, J., Zhang, R., Liu, X., Ma, C., Cao, G., Wei, Y., Yang, P.
- Source
- Full text @ Drug Des Devel Ther
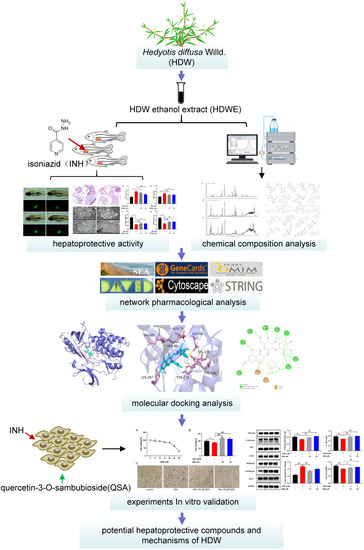
A framework for investigating the hepatoprotective effects of HDW in INH-induced liver injury in the zebrafish model and predicting the bioactive compounds molecular mechanisms. |
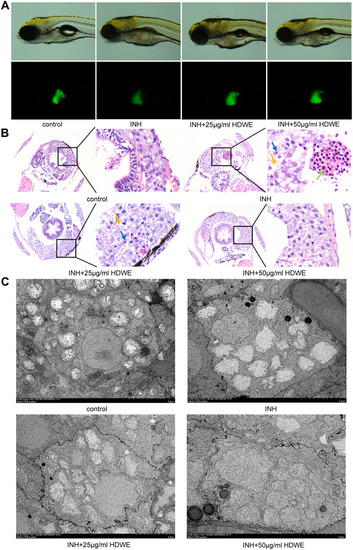
Effects of HDWE on morphological and pathological changes of liver. (A) Changes in morphology and fluorescence intensity. (B) Effects on liver tissue stained with HE. (C) Effects on liver tissue observed by TEM. |
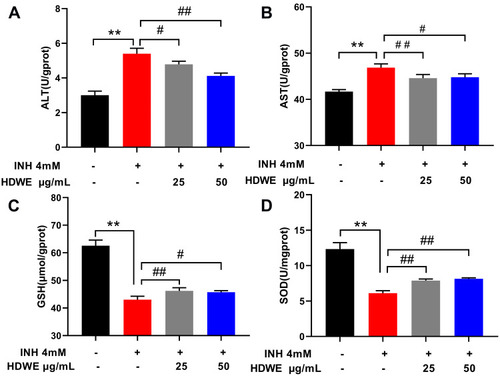
Effects of HDWE on ALT (A), AST (B), GSH (C) and SOD (D) levels. The data represent the mean ± SD (n=6). **P<0.01 vs control group; #P<0.05 vs model group; ##P< 0.01 vs model group. |
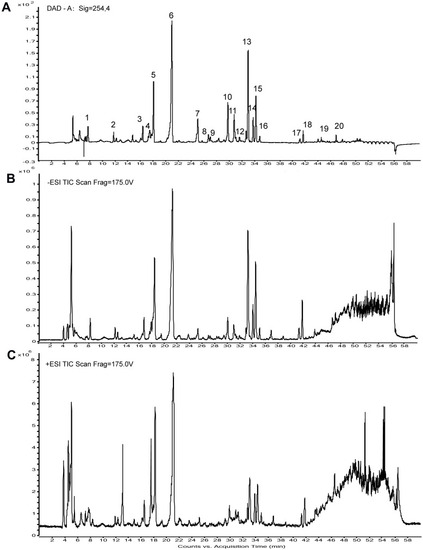
The HPLC chemical fingerprint and the total ion currents of HDWE.(A) The HPLC chemical fingerprint of HDWE. (B) The ion current of HDWE in negative ion mode. (C) The ion current of HDWE in positive ion mode. |

Chemical structures of the identified compounds from HDWE. |
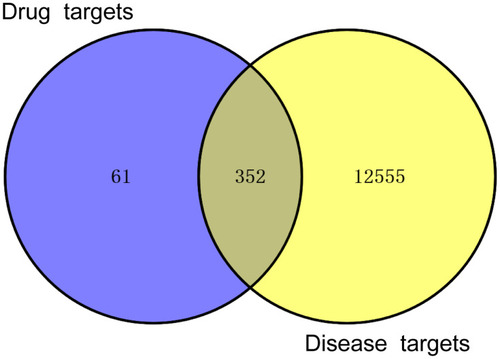
Intersection of HDWE targets and liver injury-related targets. |

The PPI network and hub targets of HDWE. (A) PPI network of the 352 potential targets. (B) The hub targets of HDWE against liver injury identified by topological analysis. |
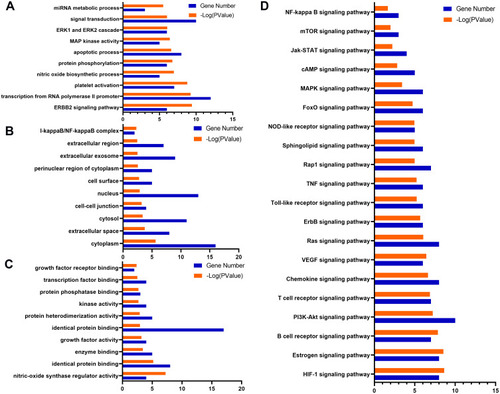
GO term performance and pathway enrichment analysis of hub targets related to liver injury. (A) GO enrichment analysis of hub targets for BP. (B) GO enrichment analysis of hub targets for CC. (C) GO enrichment analysis of hub targets for MF. (D) KEGG enrichment analysis of hub targets. The ordinate stands for GO terms or the main pathways, the primary abscissa stands for minus log 10(P), and the secondary abscissa stands for the number of major targets involved in the corresponding GO terms or the main pathways. |

Network of compound-target-pathway against liver injury. Triangle nodes with blue denote bioactive of HDWE, rhombus nodes with green denote core targets of HDWE against liver injury, and oval nodes with pink denote the significant pathways. |
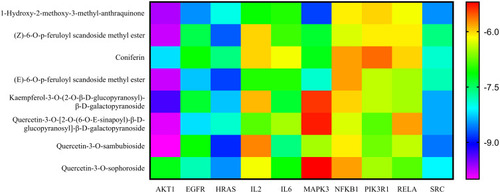
Binding energies (kcal/mol) of the nine compounds and ten targets via molecular docking. |

Molecular docking diagram of the ten targets and the main components. (A) AKT1/quercetin-3-O-sambubioside. (B) EGFR/1-Hydroxy-2-methoxy-3-methyl-anthraquinone. (C) HRAS/quercetin-3-O-sambubioside. (D) IL2/1-Hydroxy-2-methoxy-3-methyl-anthraquinone. (E) IL6/quercetin-3-O-sambubioside. (F) MAPK3/1-Hydroxy-2-methoxy-3-methyl-anthraquinone. (G) NFKB1/Z-6-O-p-feruloyl scandoside methyl ester.(H) PIK3R1/quercetin-3-O-sambubioside. (I) RELA/ E-6-O-p-feruloyl scandoside methyl ester. (J) SRC/quercetin-3-O-[2-O-(6-O-E-sinapoyl)-β-D-glucopyranosyl]-β-D-galactopyranoside. |
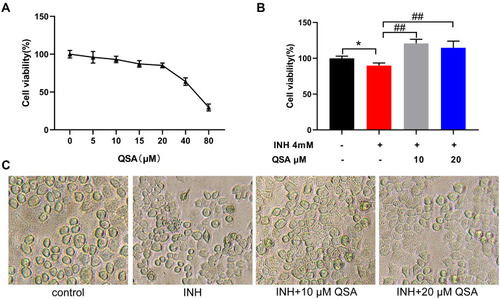
QSA reversed INH-caused the loss of cell survival rate in L02 cells. (A) Effects of different concentrations of QSA on cell survival rate of L02 cells. (B) QSA reversed INH-induced cell viability decrease. (C) Representative images of L02 cells morphology after QSA treatment. The data represent the mean ± SD (n=6). *P<0.05 vs control group; ##P< 0.01 vs model group. |
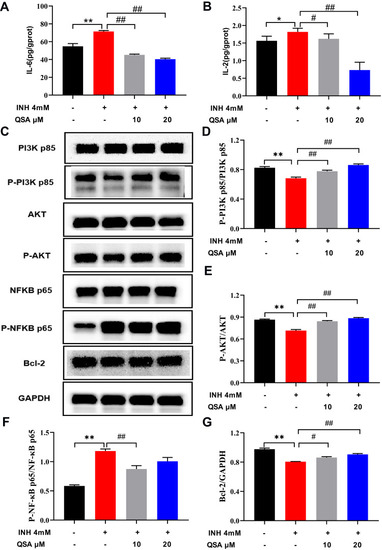
The effect of QSA on the associated proteins in INH-induced L02 cells. (A) Effects on the levels of IL-6. (B) Effects on the levels of IL-2. (C) Representative immunoblotting images of PI3K p85, p-PI3K p85, AKT, p-AKT, NFKB p65, p-NFKB p65, Bcl-2 and GAPDH. (D–G) Gray value statistics of corresponding proteins. The data represent the mean ± SD (n=3). *P<0.05 and **P<0.05 vs control group; #P< 0.05 and ##P< 0.01 vs model group. |