
Image
|
Figure Caption
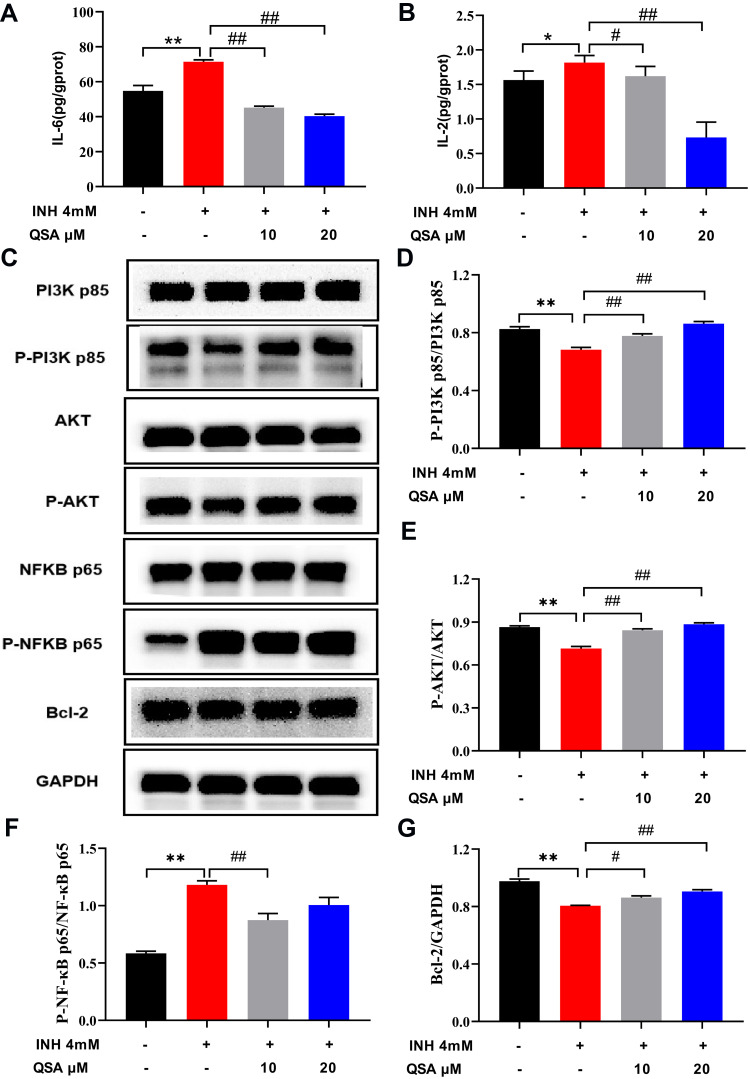
Fig. 13
The effect of QSA on the associated proteins in INH-induced L02 cells. (A) Effects on the levels of IL-6. (B) Effects on the levels of IL-2. (C) Representative immunoblotting images of PI3K p85, p-PI3K p85, AKT, p-AKT, NFKB p65, p-NFKB p65, Bcl-2 and GAPDH. (D–G) Gray value statistics of corresponding proteins. The data represent the mean ± SD (n=3). *P<0.05 and **P<0.05 vs control group; #P< 0.05 and ##P< 0.01 vs model group.
Acknowledgments
This image is the copyrighted work of the attributed author or publisher, and
ZFIN has permission only to display this image to its users.
Additional permissions should be obtained from the applicable author or publisher of the image.
Full text @ Drug Des Devel Ther