
Image
|
Figure Caption
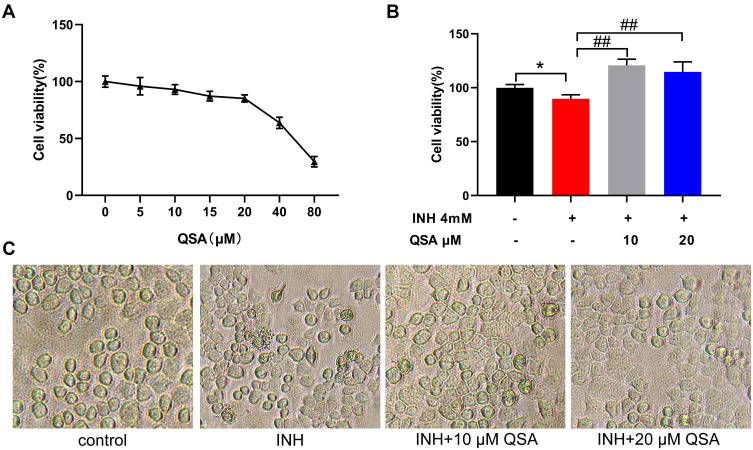
Fig. 12 QSA reversed INH-caused the loss of cell survival rate in L02 cells. (A) Effects of different concentrations of QSA on cell survival rate of L02 cells. (B) QSA reversed INH-induced cell viability decrease. (C) Representative images of L02 cells morphology after QSA treatment. The data represent the mean ± SD (n=6). *P<0.05 vs control group; ##P< 0.01 vs model group.
Acknowledgments
This image is the copyrighted work of the attributed author or publisher, and
ZFIN has permission only to display this image to its users.
Additional permissions should be obtained from the applicable author or publisher of the image.
Full text @ Drug Des Devel Ther