
- Title
-
Inhibitory Effects of Mongolian Medicine Yihe-Tang on Continuous Darkness Induced Liver Steatosis in Zebrafish
- Authors
- Sa, R., Feng, C., Bai, H., Yin, X., Song, L., Hu, X., Xu, R., Li, X., Dong, W., Yang, J.
- Source
- Full text @ Evid. Based Complement. Alternat. Med.
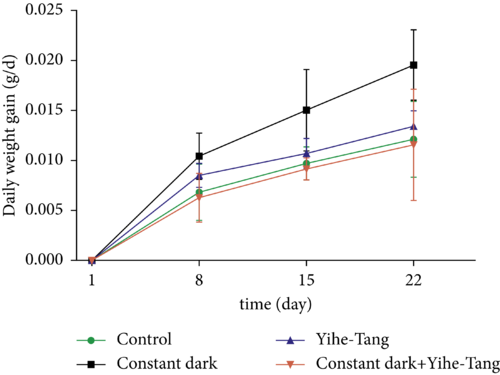
Effects of Yihe-Tang on the constant dark-induced weight gain of zebrafish. Experimental setup included four groups; control, Yihe-Tang, constant dark, and constant dark?+?Yihe-Tang group. The bodyweights of zebrafish were measured on 8?d, 15?d, and 22?d of the treatment (n?=?25?d). |
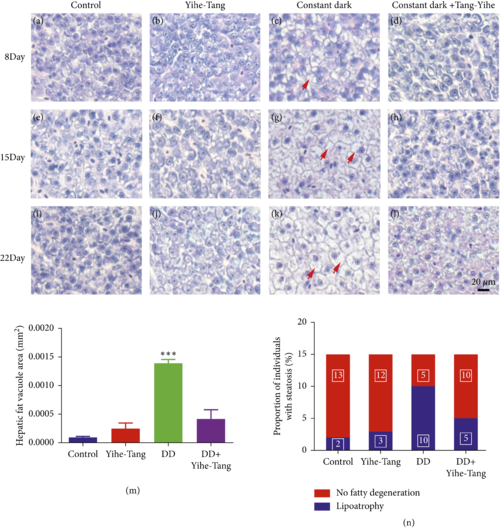
Effects of Yihe-Tang on the degeneration of fats in the zebrafish liver tissues induced by the constant darkness. ImageJ software was used to quantify the liver vacuole area. Control group: (a), (e), and (i); Yihe-Tang group: (b), (f), and (j); constant dark group: (c), (g), and (k); constant dark?+?Yihe-Tang group: (d), (h), and (l); (m): quantification of void area, (n): fatty degeneration scale, n?=?15, scale bar?=?20?�m. |

Improving effect of Yihe-Tang on the constant dark-induced liver fat accumulation in zebrafish. The zebrafish were divided into control, constant dark, Yihe-Tang, and constant dark?+?Yihe-Tang groups, after 21?d of treatment (n?=?3). Their liver tissues were collected and stained with Oil Red O to detect the histological changes in the liver of zebrafish. N?=?3, scale bar?=?20?�m. |
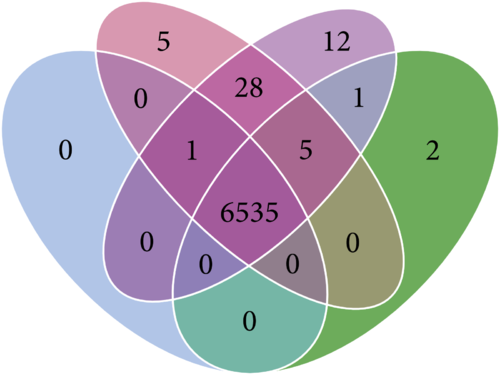
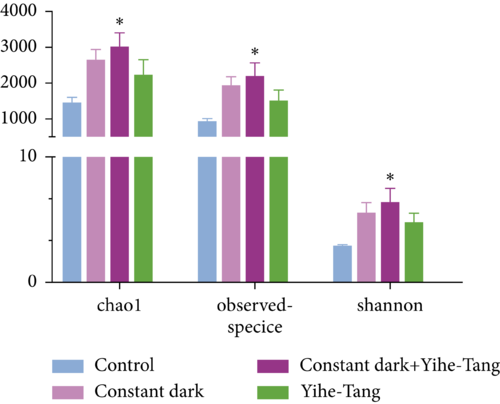
Effects of Yihe-Tang on the changes of zebrafish gut microbiota caused by the constant dark treatment. (a) Venn diagram summarizes the number of standards and different OTUs. (b) Microbial diversity index. (c) PCoA analysis. The horizontal and vertical axes in (c) represent the different principal components, and the percentage represents the contribution value of the main element to the sample difference. The data are expressed as mean, standard error (SE) of the mean (n?=?6). ?? indicates a significant difference ().
|

Effect of Yihe-Tang on the relative abundance of gut microbiota in zebrafish. (a) Relative abundance at the phylum level, (b) relative abundance at the genus level, and (c) relative abundance at the species level. The data of the top ten microbial communities with the highest relative abundances were selected from the above four groups. |
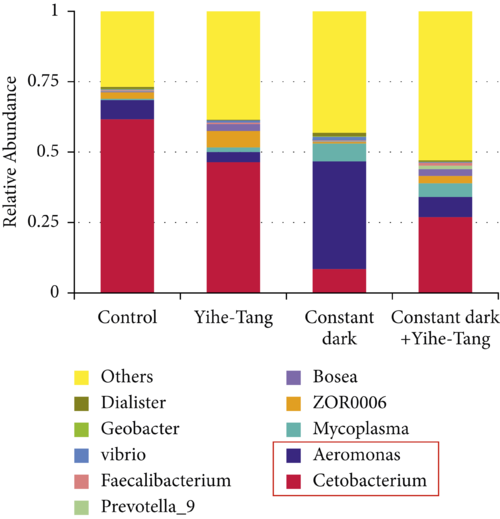
Effect of Yihe-Tang on the relative abundance of gut microbiota in zebrafish. (a) Relative abundance at the phylum level, (b) relative abundance at the genus level, and (c) relative abundance at the species level. The data of the top ten microbial communities with the highest relative abundances were selected from the above four groups. |
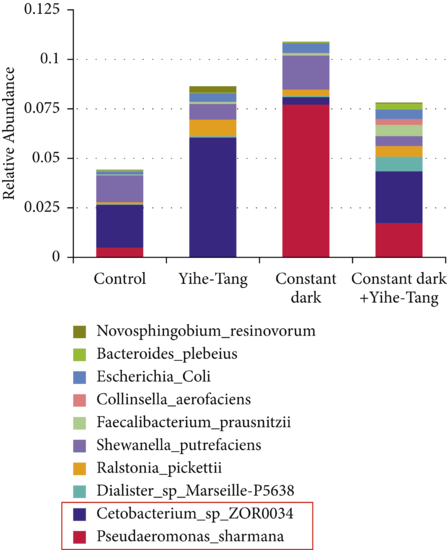
Effect of Yihe-Tang on the relative abundance of gut microbiota in zebrafish. (a) Relative abundance at the phylum level, (b) relative abundance at the genus level, and (c) relative abundance at the species level. The data of the top ten microbial communities with the highest relative abundances were selected from the above four groups. |

Clustering heat map for predicting the function of gut microbiota. The red color indicates that the abundance of gut microbiota was large or the corresponding annotation function was enhanced and vice versa for the blue color. Four groups were analyzed and compared and the microbial colonies with the highest abundances were selected for drawing. |