
Image
|
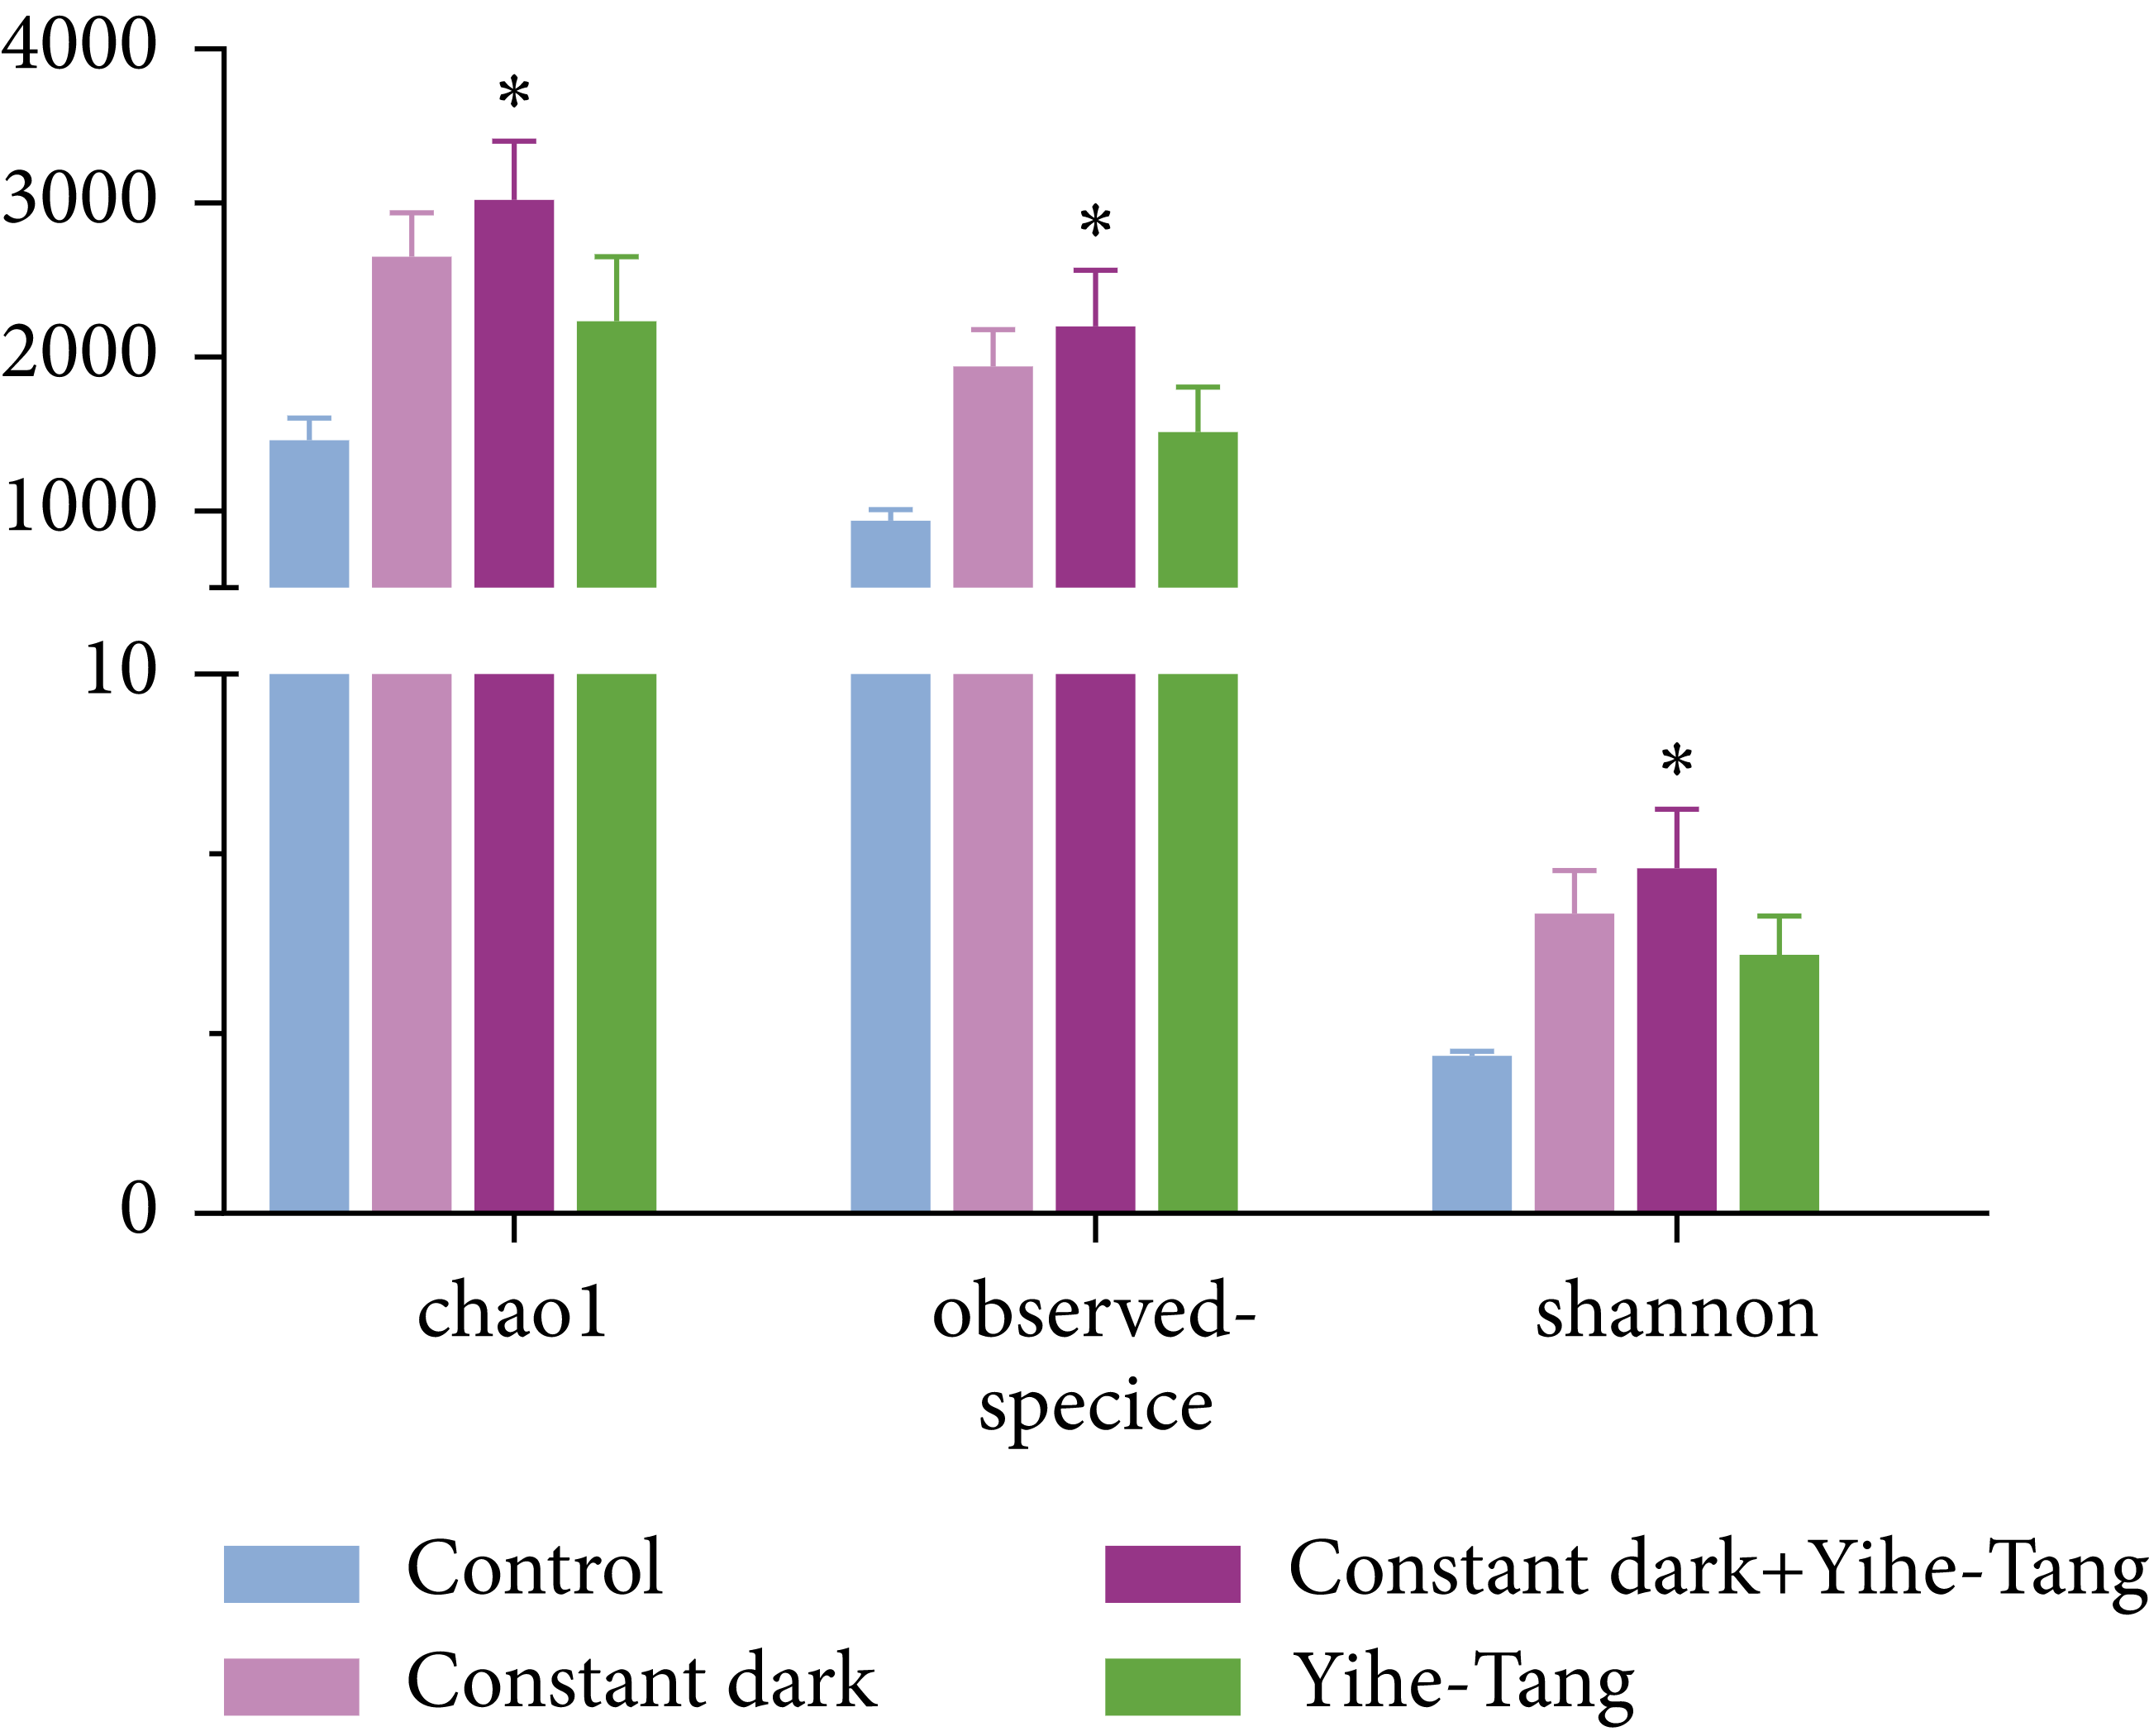
Figure Caption
Fig. 4B
Effects of Yihe-Tang on the changes of zebrafish gut microbiota caused by the constant dark treatment. (a) Venn diagram summarizes the number of standards and different OTUs. (b) Microbial diversity index. (c) PCoA analysis. The horizontal and vertical axes in (c) represent the different principal components, and the percentage represents the contribution value of the main element to the sample difference. The data are expressed as mean, standard error (SE) of the mean (n = 6). “” indicates a significant difference ().
Acknowledgments
This image is the copyrighted work of the attributed author or publisher, and
ZFIN has permission only to display this image to its users.
Additional permissions should be obtained from the applicable author or publisher of the image.
Full text @ Evid. Based Complement. Alternat. Med.