
Image
|
Figure Caption
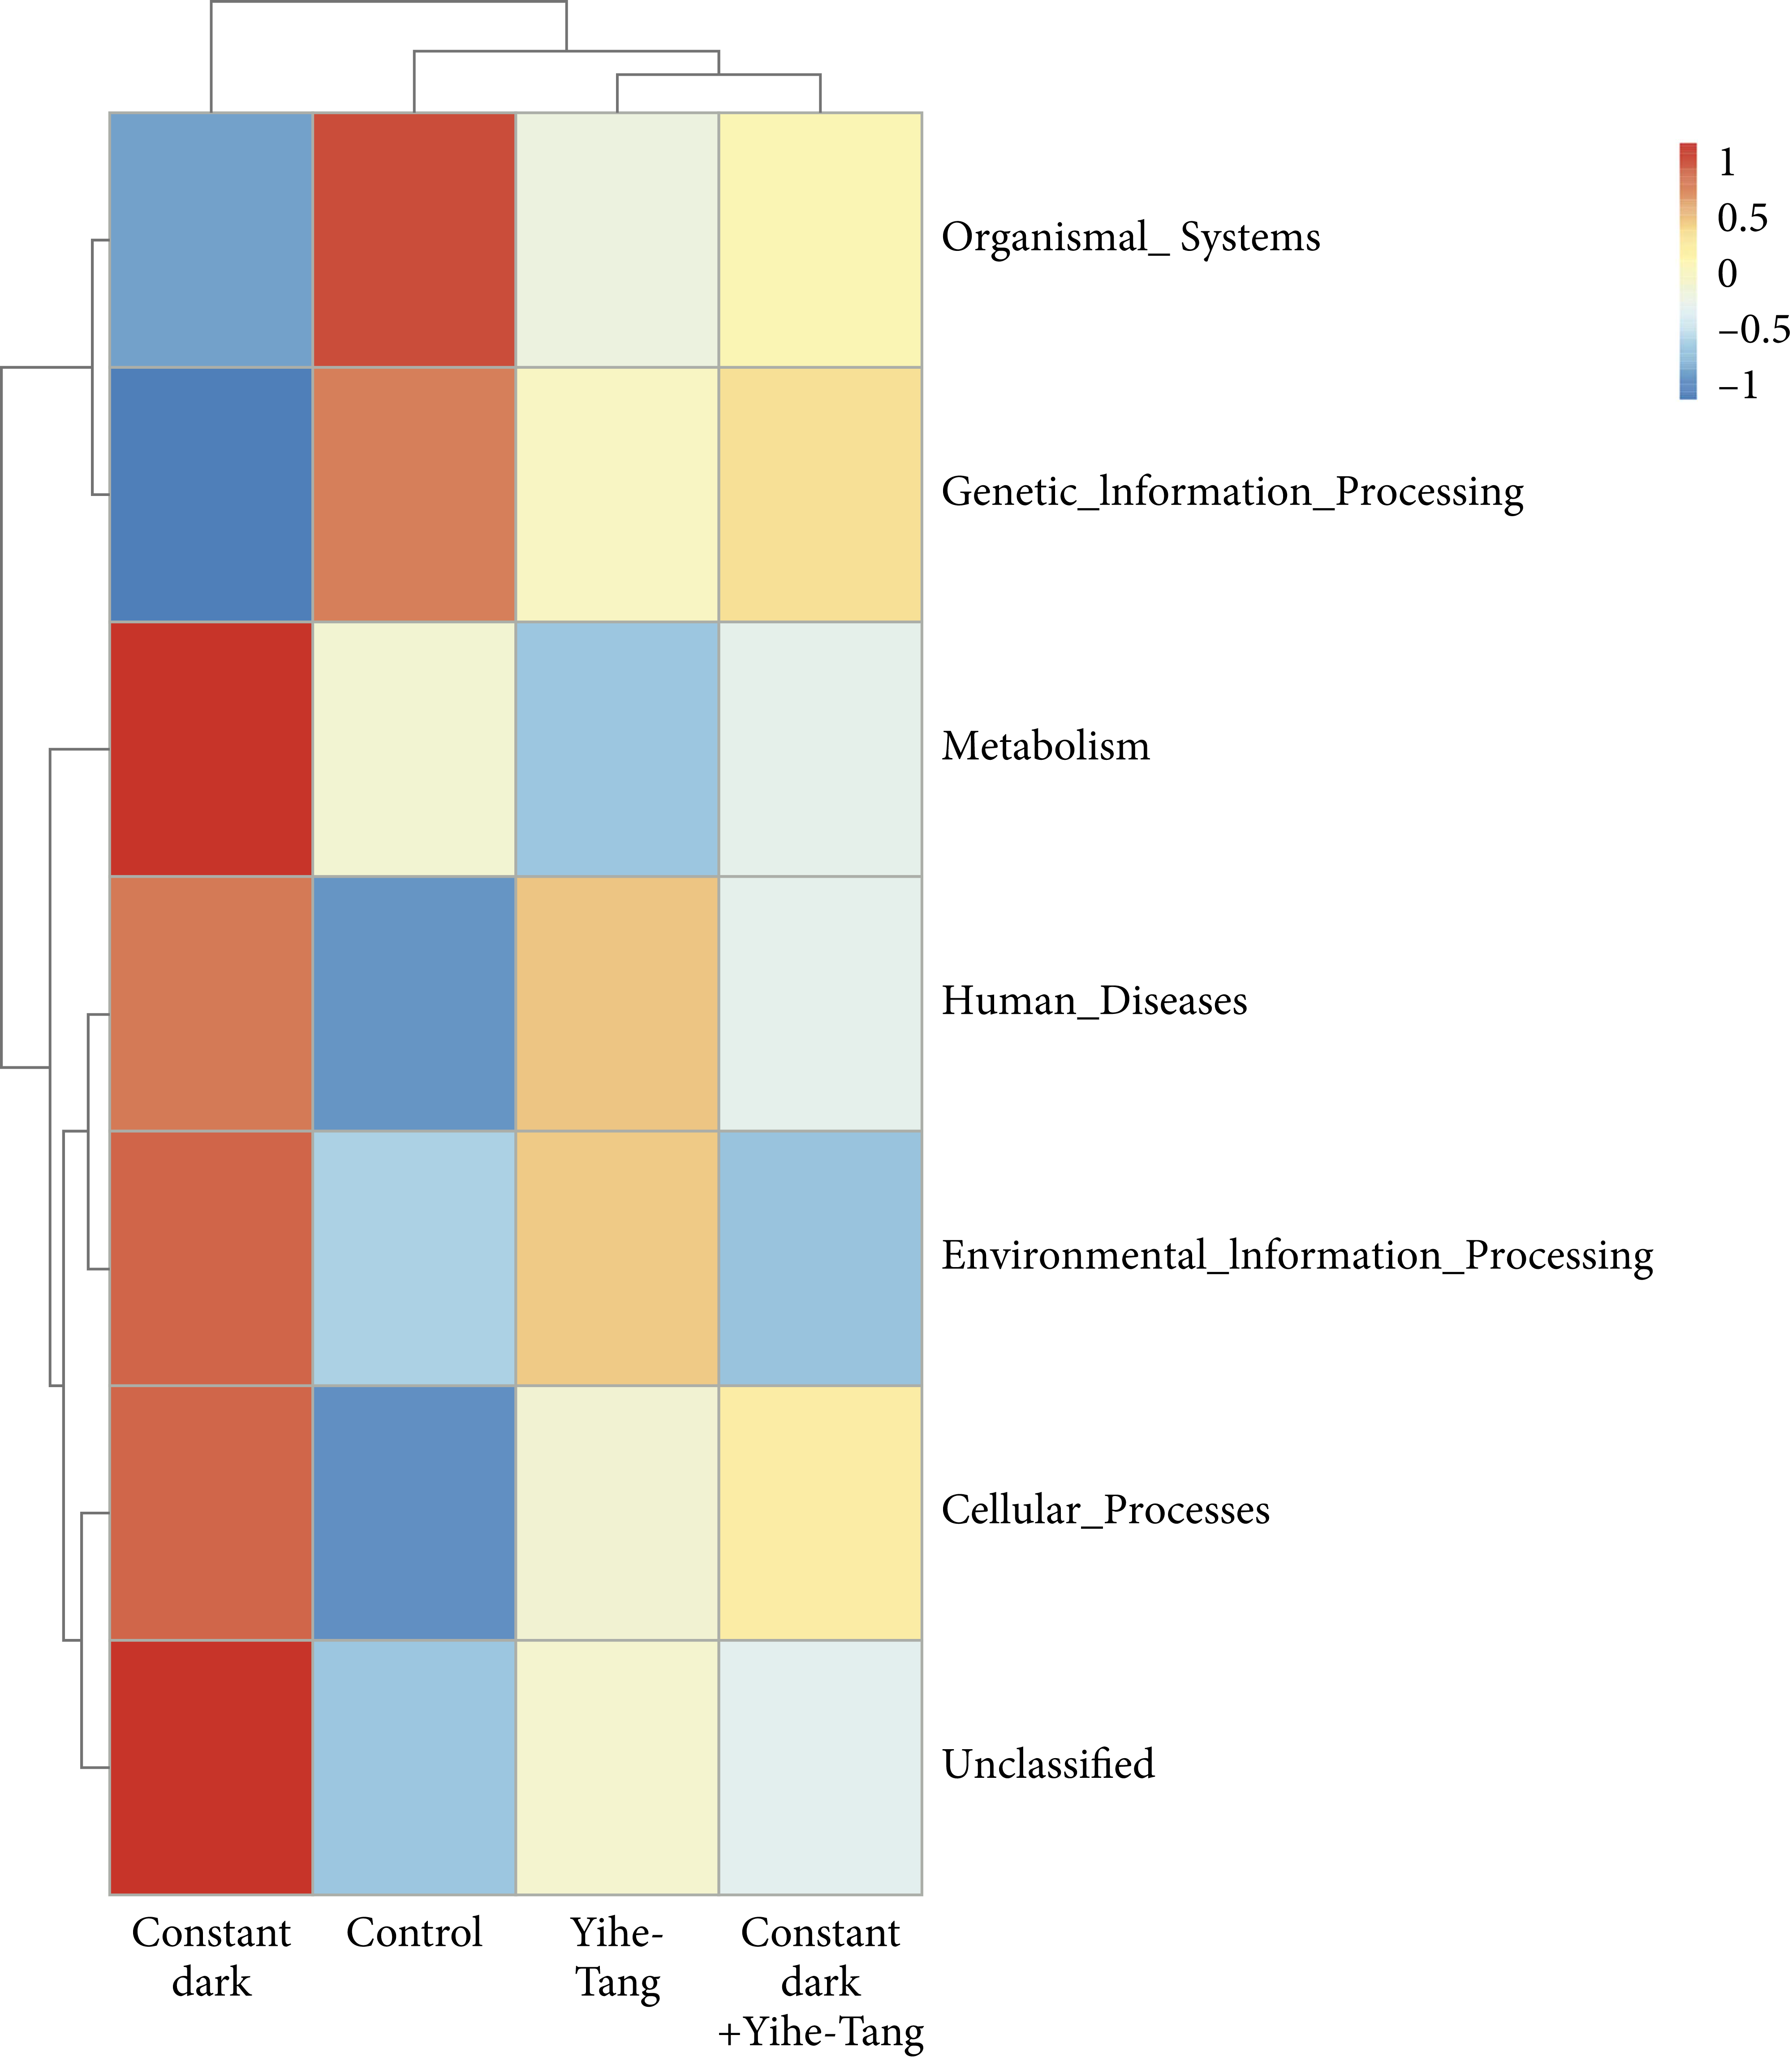
Fig. 6 Clustering heat map for predicting the function of gut microbiota. The red color indicates that the abundance of gut microbiota was large or the corresponding annotation function was enhanced and vice versa for the blue color. Four groups were analyzed and compared and the microbial colonies with the highest abundances were selected for drawing.
Acknowledgments
This image is the copyrighted work of the attributed author or publisher, and
ZFIN has permission only to display this image to its users.
Additional permissions should be obtained from the applicable author or publisher of the image.
Full text @ Evid. Based Complement. Alternat. Med.