
- Title
-
A basement membrane discovery pipeline uncovers network complexity, regulators, and human disease associations
- Authors
- Jayadev, R., Morais, M.R.P.T., Ellingford, J.M., Srinivasan, S., Naylor, R.W., Lawless, C., Li, A.S., Ingham, J.F., Hastie, E., Chi, Q., Fresquet, M., Koudis, N.M., Thomas, H.B., O'Keefe, R.T., Williams, E., Adamson, A., Stuart, H.M., Banka, S., Smedley, D., Genomics England Research Consortium, Sherwood, D.R., Lennon, R.
- Source
- Full text @ Sci Adv
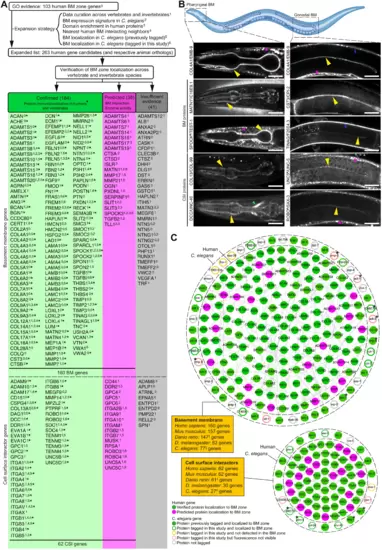
(A) Strategy for identifying putative BM matrix protein and CSI genes in humans and other species. Protein localization to BM zone was either (i) confirmed through vertebrate tissue immunolocalization (green column) or (ii) predicted on the basis of BM protein interaction or BM-cleaving protease activity (magenta column). Fluorescent tagging studies in C. elegans provided further localization support for components in both columns. Genes with insufficient evidence are in the gray column. *160 components are localized to the human BM zone. (B) Top: Schematic representation of the pharyngeal and gonadal BMs in C. elegans (Biorender). Middle: Confocal mid-plane z-slices of adult animals expressing endogenously tagged COL4A1/EMB-9::mRuby2. Bottom: Selected BM zone candidates tagged with mNG in this study. BM zone localization in respective tissues is indicated by yellow (pharynx and gonad), blue (body wall muscle), and green (nerve ring) arrowheads. Asterisks denote punctate intracellular signal within body wall muscle tissue, a major site of BM protein synthesis. †MATN1 is a predicted human candidate and its ortholog localized to the BM zone in C. elegans. #Localization evidence present for two of four UNC5, one of three SPOCK, and one of four ROBO family members in humans (table S7). Scale bars, 25 μm. (C) Integrated BM zone network of 222 human genes (circles, 160 BM matrix and 62 CSI components) with corresponding C. elegans orthologs (octagons). Lines link ortholog pairs. Boxes indicate number of ortholog genes in mouse, zebrafish, Drosophila, and C. elegans. *Complex ortholog families in C. elegans (detailed in fig. S4). †Duplicated zebrafish genes were counted as one; worm §astacins and #tetraspanins are not included. Network is curated at https://bmbase.manchester.ac.uk/. |

(A) Interactomes (based on published proteomic datasets) representing the diversity of BM composition across human tissues. Proteins are depicted as nodes sized according to their log-transformed relative tissue abundance. Lines represent protein interactions determined by STRING analysis (table S4). (B) Heatmaps derived from published transcriptomic datasets (table S9) depict either very high or low expression variance of BM zone genes across multiple human tissues. (C) Classification of human and mouse BM and CSI genes with differing expression variance according to matrisome category. (D) Overlap between human BM zone genes and mouse orthologs for very high or low expression variance. See fig. S5 and table S10 for extended expression variance data. |

(A) Dot plot depicts conserved and enriched InterPro protein domains in BM zone components. Dots are sized according to number of domain occurrences within BM genes (count ratio; table S3). (B) Domain-based interactome for human BM zone genes. Nodes represent BM and CSI proteins and are sized according to network degree score. Lines connecting nodes are color-coded to indicate the number of shared domains. Black and red arrowheads highlight hub proteins with the highest degree and betweenness centrality scores, respectively (table S11). (C) Domain structure of the hub protein HSPG2/perlecan. Bar chart shows the number of BM zone proteins sharing specific domains with HSPG2. (D) Left: Representative confocal sum projections of C. elegans gonadal BM LAMC/LAM-2::mNG in control versus HSPG2/unc-52 RNA interference (RNAi)–treated 72-hour adult animals (n = 10 animals examined each; additional supporting images are available on figshare: 10.6084/m9.figshare.c.5662348). Top right: Middle-plane confocal z-slice of HSPG2/UNC-52::mNG in an adult animal. Yellow arrowhead indicates fluorescence signal in the gonadal BM, and asterisks denote strong signal in the body wall muscle BM and muscle-epidermal attachment sites. Bottom right: Quantification of gonadal BM UNC-52::mNG levels throughout postembryonic development (n ≥ 13 for each developmental stage; fluorescence was not detected between early L1 and early L4 stages). Scale bar, 25 μm. For boxplots, edges indicate the 25th and 75th percentiles, the line in the box represents the median, and whiskers mark the minimum and maximum values. a.u., arbitrary units. |

(A) Heatmap summarizing changes in LAMC/LAM-2::mNG and COL4A1/EMB-9::mRuby2 fluorescence in the gonadal BM upon target gene knockdown in C. elegans. (B) Confocal middle-plane z-slices of gonadal BM LAMC/LAM-2::mNG and COL4A1/EMB-9::mRuby2 in control and RNAi-targeted adt-2, dbl-1, and sax-3 72-hour adult animals (boxed regions are magnified in insets) with quantifications of fluorescence intensity shown on the right (n ≥ 20 each). ****P < 0.0001; ns, not significant; one-way analysis of variance (ANOVA) with post hoc Dunnett’s test. Scale bars, 25 μm. (C) Schematic of a zebrafish embryo [5 days postfertilization (dpf); Biorender] with transversal cross sections depicting tissues in the cranium and the trunk. (D) Confocal images of type IV collagen immunofluorescence in trunk sections of controlgRNA-, adamts3gRNA-, and robo1gRNA-injected 5-dpf embryos. Fluorescence intensity within the entire section is quantified on the bottom right (n = 5 for each treatment). ***P < 0.001, one-way ANOVA with post hoc Dunnett’s test. Scale bars, 30 μm. (E) Collagen IV immunofluorescence in cranial sections of controlgRNA- and adamts3gRNA-injected 5-dpf embryos with quantification of fluorescence intensity on the right (n = 5 for each treatment). ***P < 0.001, unpaired Student’s t test. Scale bars, 30 μm. (F) Collagen IV immunofluorescence in trunk sections of 5-dpf embryos treated with dimethyl sulfoxide (DMSO; control) or SB431542 (TGFBR1 inhibitor) on the left [2-day treatment between 24 and 72 hours postfertilization (hpf)]; quantification of fluorescence intensity on the right (n = 5 each). ***P < 0.001, unpaired Student’s t test. Scale bars, 30 μm. For boxplots, edges indicate the 25th and 75th percentiles, the line in the box represents the median, and whiskers mark the minimum and maximum values. |
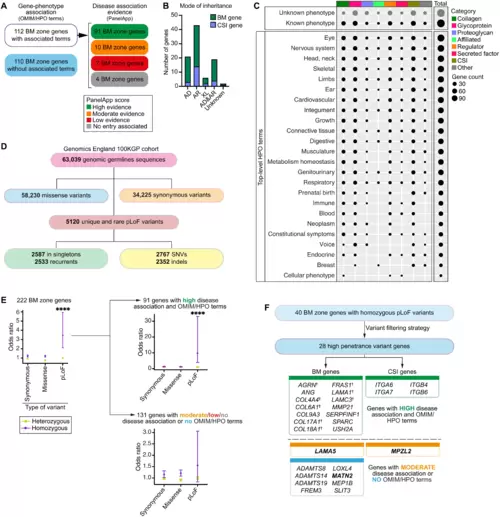
(A) Classification of BM zone genes according to phenotypes within OMIM and HPO databases (left) and level of evidence for disease causation within the Genomics England PanelApp database (right) (see also tables S13 and S14). (B) Bar chart depicting mode of inheritance for 112 BM zone genes with disease associations (AD, autosomal dominant; AR, autosomal recessive; XL, X-linked). (C) Dot plot illustrates phenotypic abnormalities (HPO terms) associated with BM zone genes grouped by their matrisome classifications. Dot size indicates gene count in each category. (D) Landscape of BM zone gene variants identified in the Genomics England 100KGP cohort (table S16). SNVs, single-nucleotide variants. (E) Odds ratio (OR) plots (comparing individuals with disease to unaffected relatives) for all variants (left) or variants grouped according to disease association evidence for the respective BM zone genes (right). ****P < 0.0001, Fisher’s exact test. (F) High-penetrance homozygous predicted LoF (pLoF) variants were identified for 28 BM zone genes, including †components previously associated with BM-linked disease, and disease candidates. Potential disease-causing mechanisms were investigated for genes highlighted in bold. |
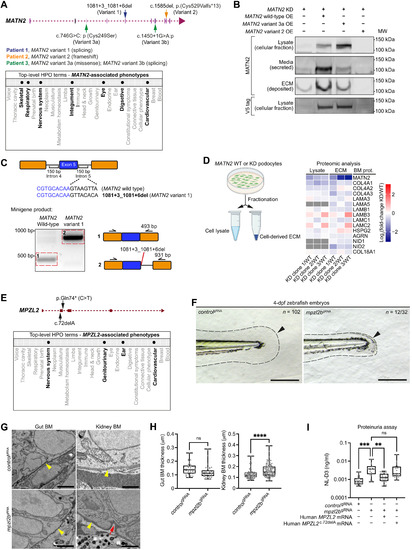
(A) MATN2 genomic structure indicating four pLoF variants (top) and associated phenotypic abnormalities represented as HPO terms (bottom, bolded). (B) Western blots of MATN2 in lysate and ECM fractions derived from endogenous MATN2-depleted human podocytes overexpressing V5-tagged wild-type or variant MATN2. Note that the faint band in the ECM fraction for the MATN2-KD lane is likely residual endogenous MATN2 due to variability in MATN2 knockdown. Immunoblotting source data are available on figshare: 10.6084/m9.figshare.c.5662348. (C) In vitro minigene splicing assay demonstrating altered splicing of MATN2 variant 1. bp, base pairs. (D) Fold change in BM component levels upon MATN2 knockdown as determined by fractional proteomic analysis of podocyte-derived ECM (see table S18; additional quantification data are available on figshare: 10.6084/m9.figshare.c.5662348). (E) MPZL2 genomic structure indicating two 100KGP pLoF variants (top) and associated phenotypic abnormalities (bottom, bolded). (F) Bright-field images of tail regions (dashed lines) in controlgRNA- and mpzl2bgRNA-injected 4-dpf zebrafish embryos. Arrowheads highlight reduced fin fold extension in mpzl2b crispants. Scale bars, 100 μm. (G) Transmission electron microscopy (TEM) of gut and kidney BMs (yellow arrowheads) in control and mpzl2b crispant embryos. Red arrows indicate BM irregularities. Scale bars, 2 μm (gut) and 1 μm (kidney). (H) Quantification of gut (n = 39 each) and kidney (n = 100 each) BM thickness. ****P < 0.0001, unpaired Student’s t test. (I) Assessment of proteinuria (NL-D3 levels) in mpzl2b crispants injected with wild-type human MPZL2 mRNA or MPZL2c.72del variant mRNA (n = 24 each). ***P < 0.001 and **P < 0.01, one-way ANOVA with post hoc Dunnett’s test. For boxplots, edges indicate the 25th and 75th percentiles, the line in the box represents the median, and whiskers mark the minimum and maximum values. |

(A) Top: Genetic pedigree for a 100KGP family carrying two LAMA5 pLoF variants. Bottom: Phenotypic abnormalities observed in two LAMA5 variant–carrying fetuses (19- and 20-week gestation) represented as bolded HPO terms. (B) Top: LAMA5 genomic structure and variant locations. Bottom: In vitro minigene splicing assay demonstrating altered splicing of LAMA5 variant 1b. (C) Left: Picrosirius red/Fast Green staining of the 19-week dysplastic kidney; asterisks indicate cysts. Boxed area is magnified on the right; arrowhead and arrows denote abnormal glomerulus and tubules, respectively. Scale bars, 5 mm (left) and 100 μm (right). (D) Pan-laminin (LAM; magenta) and laminin β2 (LAMB2; green) immunofluorescence in normal (left) and dysplastic (right) fetal kidney sections. Asterisks indicate laminin surrounding a cyst. Boxed regions are magnified below. Arrowheads, see text. Scale bars, 50 μm. Full uncropped images are available on figshare: 10.6084/m9.figshare.c.5662348. (E) Bright-field images of zebrafish tail regions (dashed lines) in controlgRNA- and lama5gRNA-injected 4-dpf embryos. Arrowheads highlight reduced fin fold extension in lama5 crispants. Scale bars, 100 μm. (F) TEM of gut and kidney BMs (yellow arrowheads) in control and lama5 crispants. Boxed regions are magnified in insets. Red arrows indicate BM morphological irregularities. Scale bars, 2 μm (gut) and 1 μm (kidney). (G) Proteinuria in control versus lama5 crispants (n = 24 each). ***P < 0.001, unpaired Student’s t test. For boxplots, edges indicate the 25th and 75th percentiles, the line in the box represents the median, and whiskers mark the minimum and maximum values. |
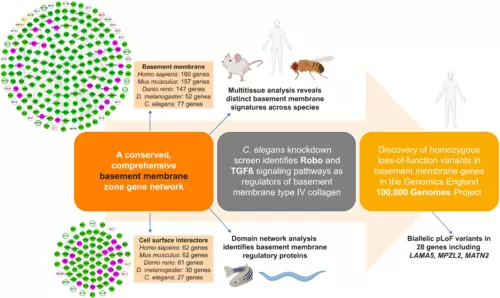
Summary of multidisciplinary approaches and model systems used in this study that established a comprehensive network of BM matrix proteins and their CSIs, uncovered regulators of BM structure and function, and identified BM component genomic variants associated with phenotypic abnormalities in 100KGP. |

ZFIN is incorporating published figure images and captions as part of an ongoing project. Figures from some publications have not yet been curated, or are not available for display because of copyright restrictions. |