
Fig. 5
- ID
- ZDB-IMAGE-220519-5
- Publication
- Jayadev et al., 2022 - A basement membrane discovery pipeline uncovers network complexity, regulators, and human disease associations
- All Figures
- Figures for Jayadev et al., 2022
|
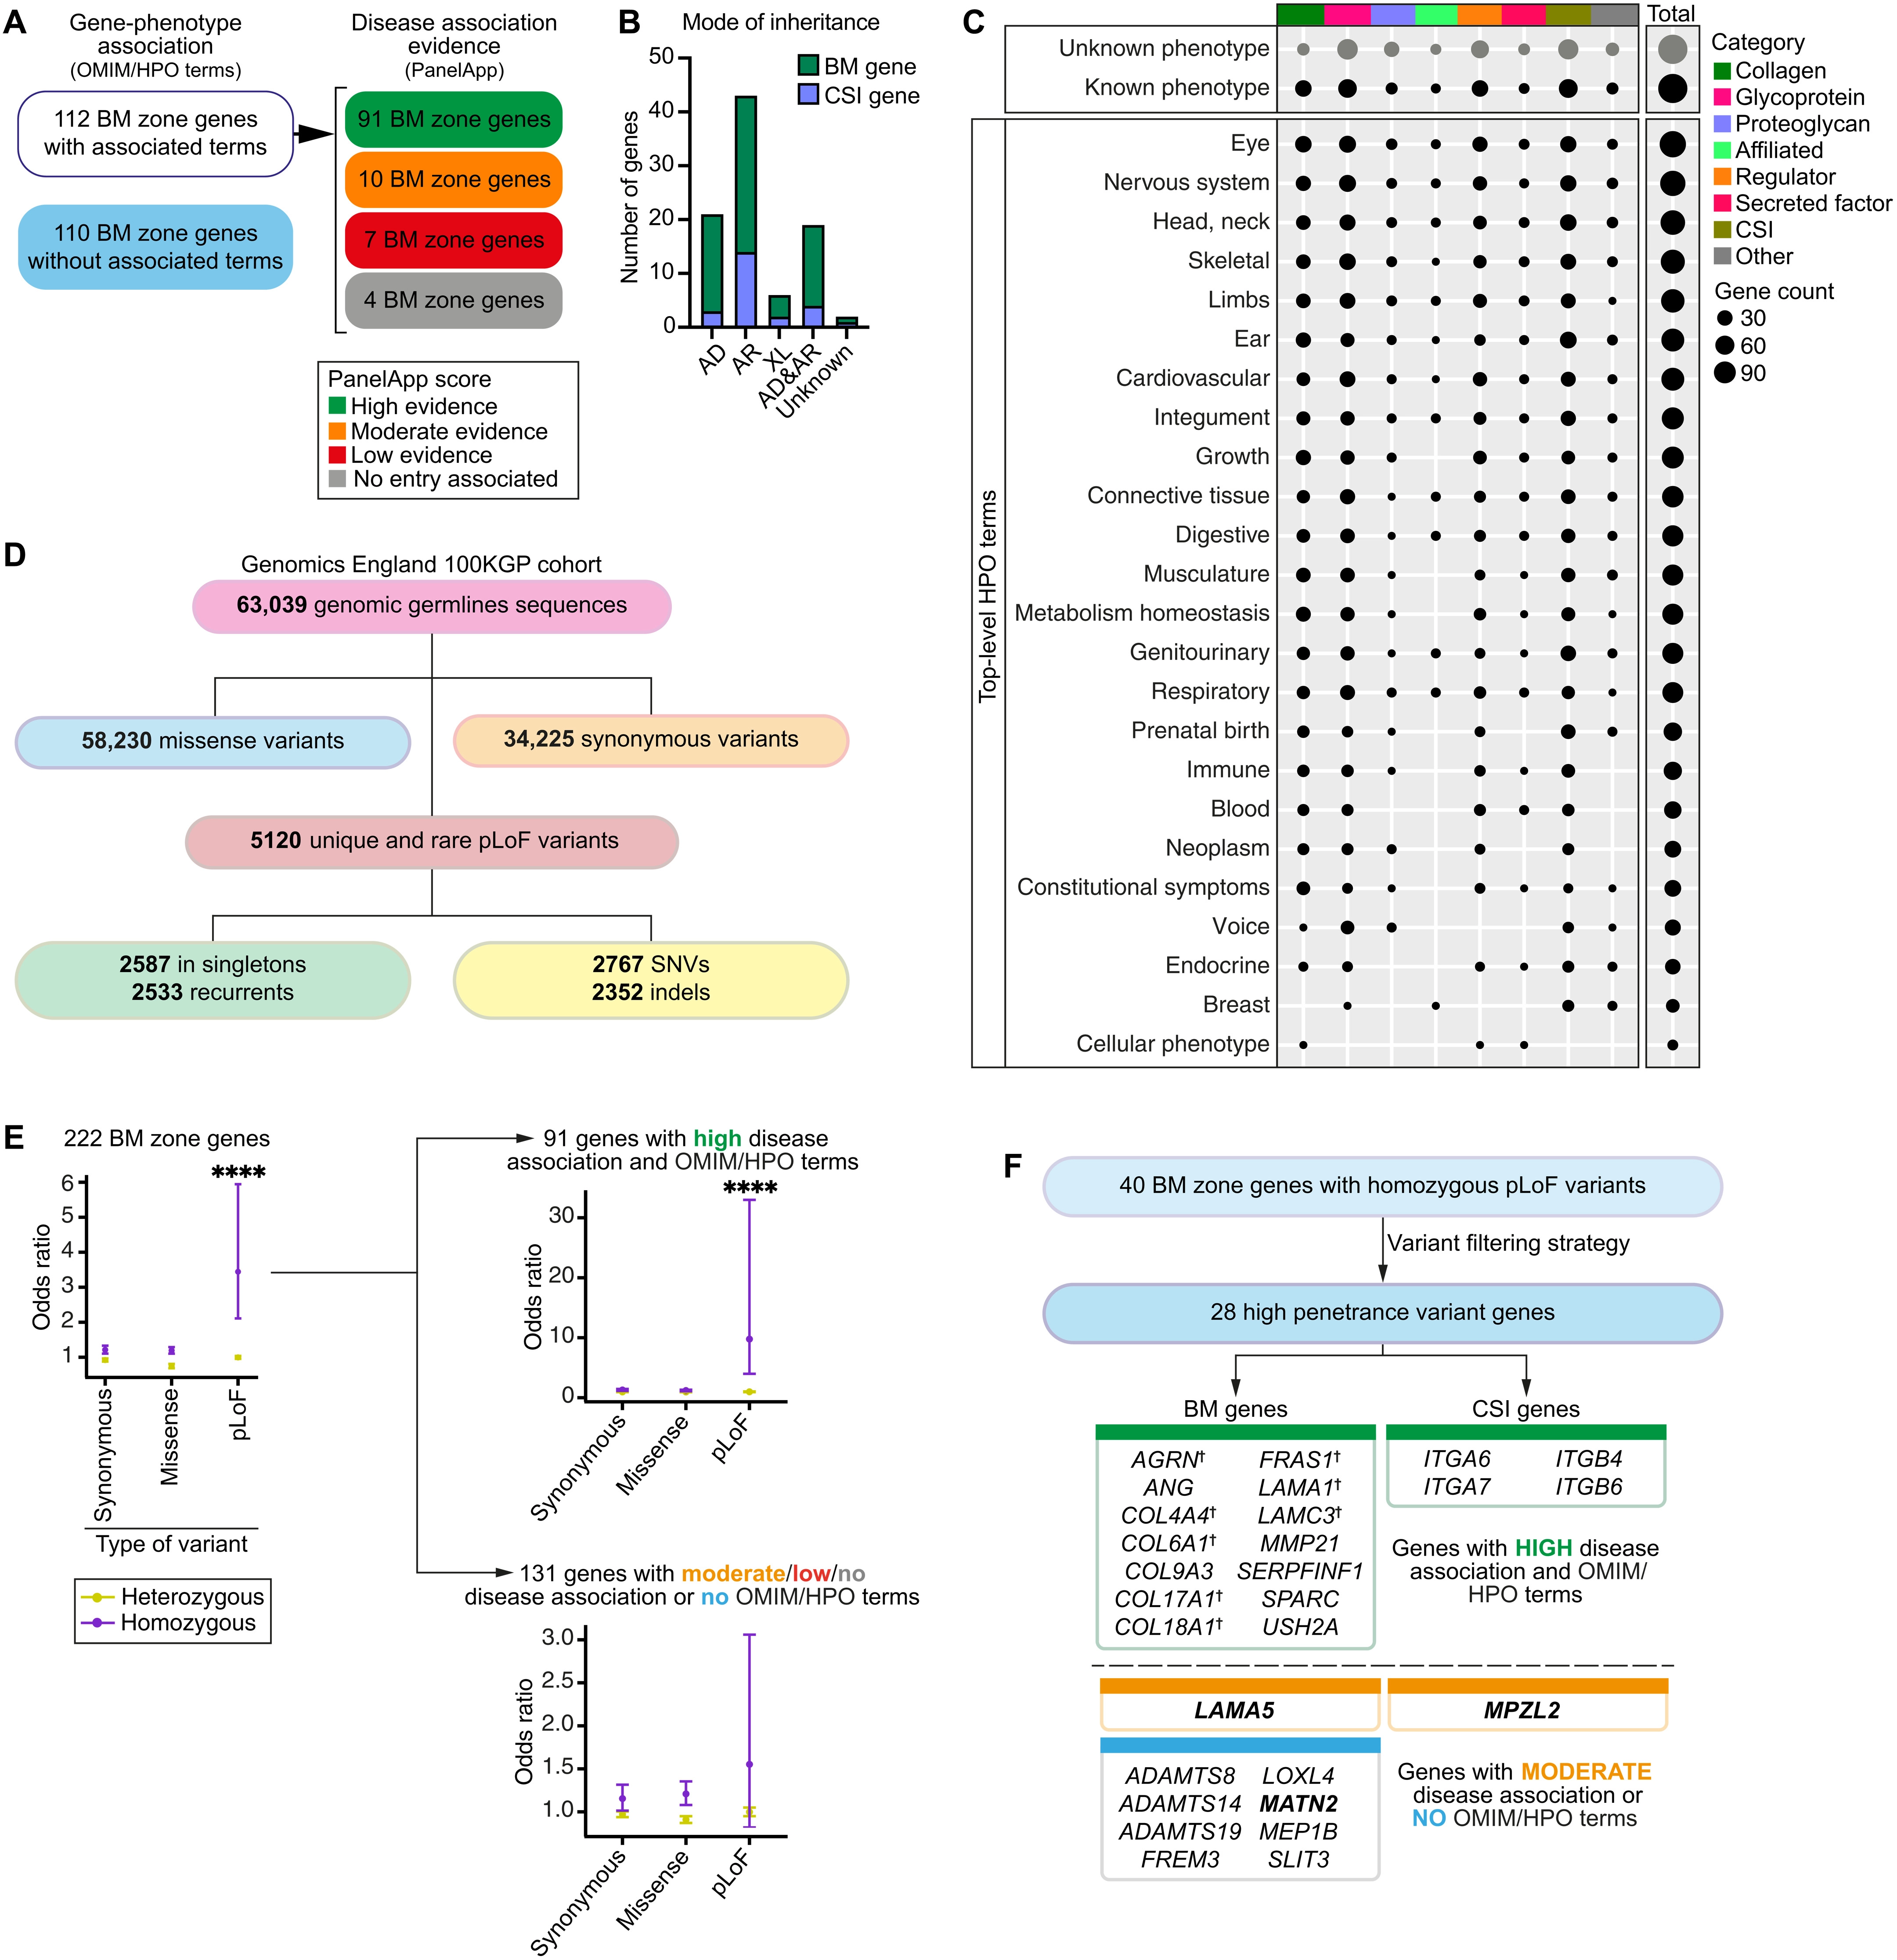
Fig. 5 (A) Classification of BM zone genes according to phenotypes within OMIM and HPO databases (left) and level of evidence for disease causation within the Genomics England PanelApp database (right) (see also tables S13 and S14). (B) Bar chart depicting mode of inheritance for 112 BM zone genes with disease associations (AD, autosomal dominant; AR, autosomal recessive; XL, X-linked). (C) Dot plot illustrates phenotypic abnormalities (HPO terms) associated with BM zone genes grouped by their matrisome classifications. Dot size indicates gene count in each category. (D) Landscape of BM zone gene variants identified in the Genomics England 100KGP cohort (table S16). SNVs, single-nucleotide variants. (E) Odds ratio (OR) plots (comparing individuals with disease to unaffected relatives) for all variants (left) or variants grouped according to disease association evidence for the respective BM zone genes (right). ****P < 0.0001, Fisher’s exact test. (F) High-penetrance homozygous predicted LoF (pLoF) variants were identified for 28 BM zone genes, including †components previously associated with BM-linked disease, and disease candidates. Potential disease-causing mechanisms were investigated for genes highlighted in bold.