
Fig. 2
- ID
- ZDB-IMAGE-220519-2
- Publication
- Jayadev et al., 2022 - A basement membrane discovery pipeline uncovers network complexity, regulators, and human disease associations
- All Figures
- Figures for Jayadev et al., 2022
|
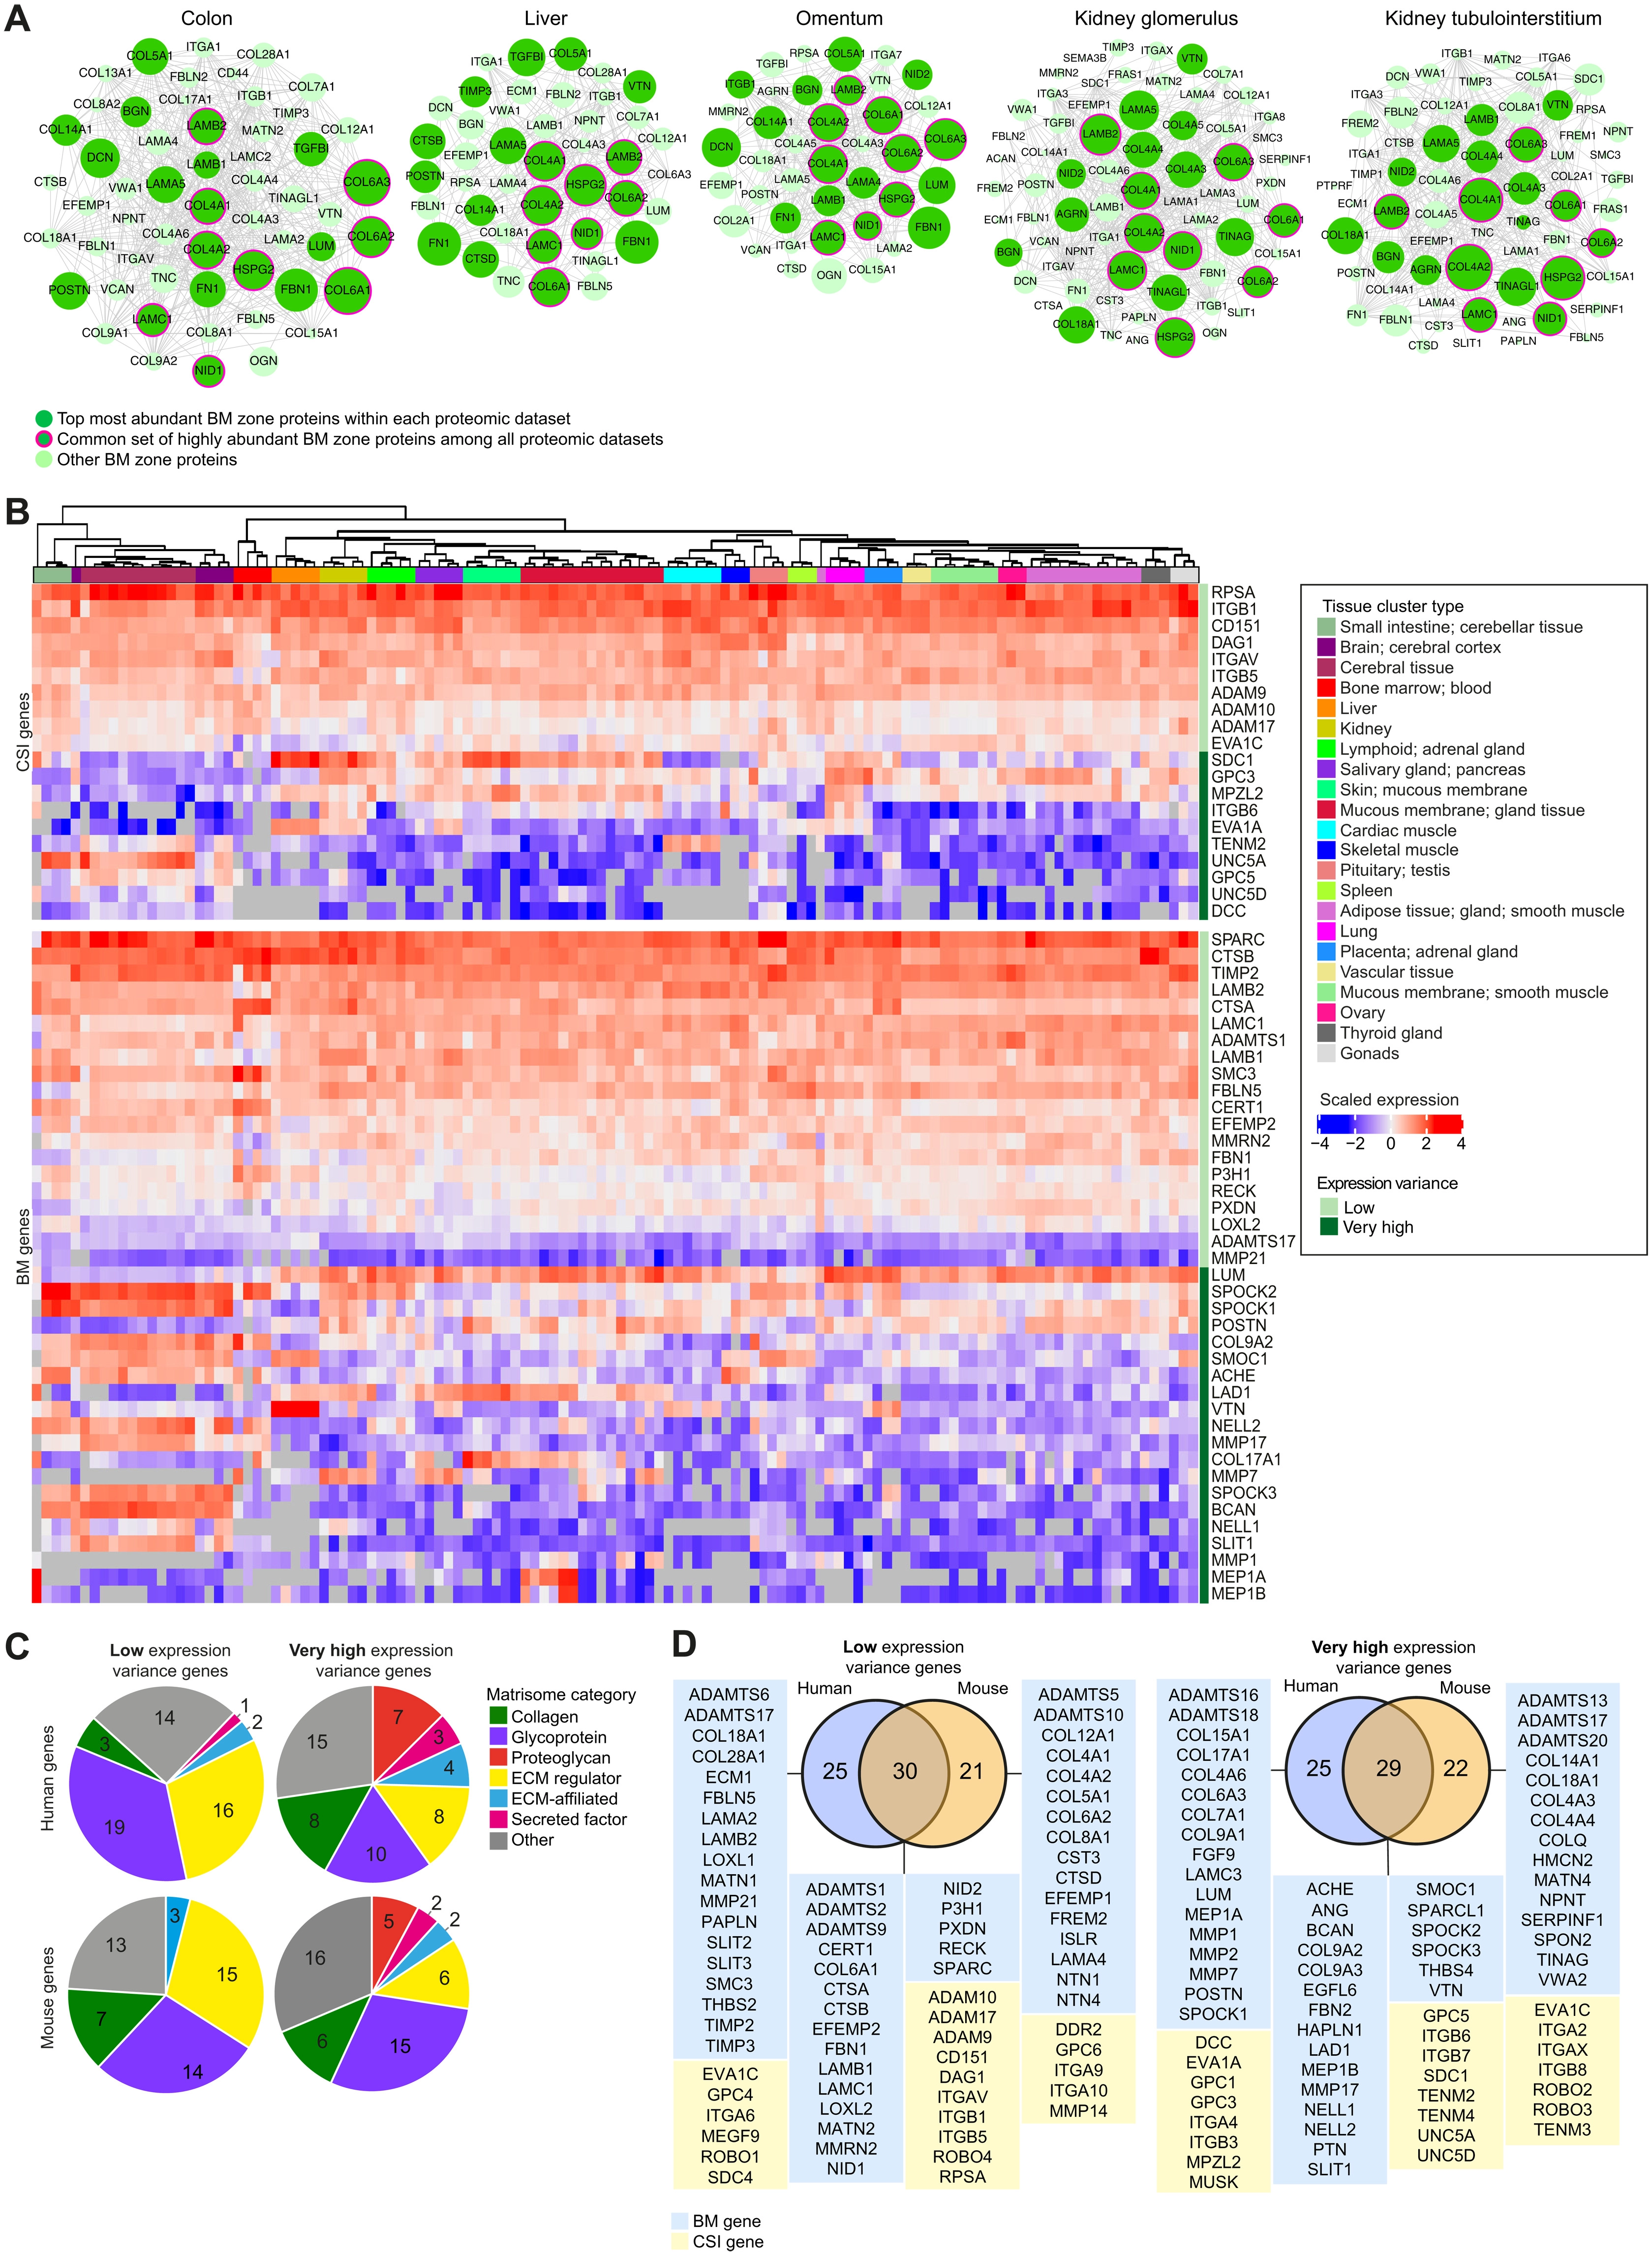
Fig. 2 (A) Interactomes (based on published proteomic datasets) representing the diversity of BM composition across human tissues. Proteins are depicted as nodes sized according to their log-transformed relative tissue abundance. Lines represent protein interactions determined by STRING analysis (table S4). (B) Heatmaps derived from published transcriptomic datasets (table S9) depict either very high or low expression variance of BM zone genes across multiple human tissues. (C) Classification of human and mouse BM and CSI genes with differing expression variance according to matrisome category. (D) Overlap between human BM zone genes and mouse orthologs for very high or low expression variance. See fig. S5 and table S10 for extended expression variance data.