
- Title
-
Age-Dependent Effects of Chronic Stress on Zebrafish Behavior and Regeneration
- Authors
- Henríquez Martínez, A., Ávila, L.C., Pulido, M.A., Ardila, Y.A., Akle, V., Bloch, N.I.
- Source
- Full text @ Front. Physiol.

Experimental design. Fish in the stress group were exposed to an 8-day stress protocol (UCS), while fish in the control group remained under standard conditions. All fish were subjected to behavioral tests before and after the stress protocol. On day 10, caudal fins were amputated, and growth measurements were recorded on days 13, 16, 19, and 23. |
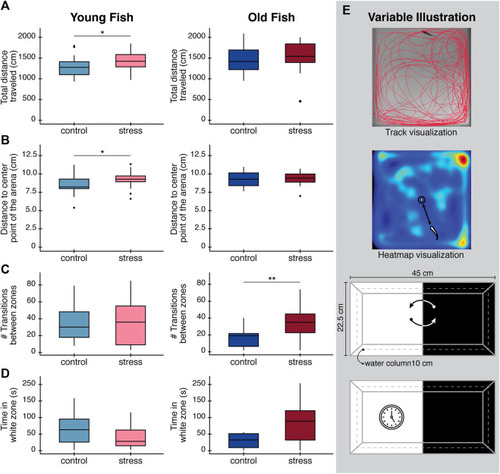
Effects in behavioral parameters (open field test and light/dark preference test) in zebrafish after exposure to a chronic stress protocol at day 9. |

Regeneration process after the stress protocol. The regeneration index is calculated as the length of the regenerated tissue/initial length of the caudal fin of each fish measured from the most proximal part of the lepidotrichia. |
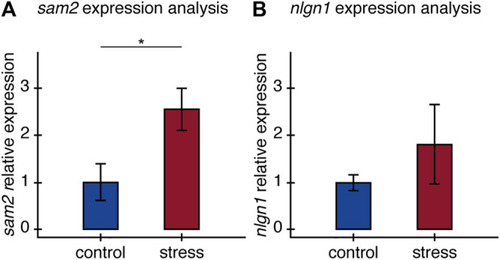
Relative expression of |