IMAGE

FIGURE 2

ID
ZDB-IMAGE-220518-25
Source
Figures for Henríquez Martínez et al., 2022
Image
Figure Caption

FIGURE 2

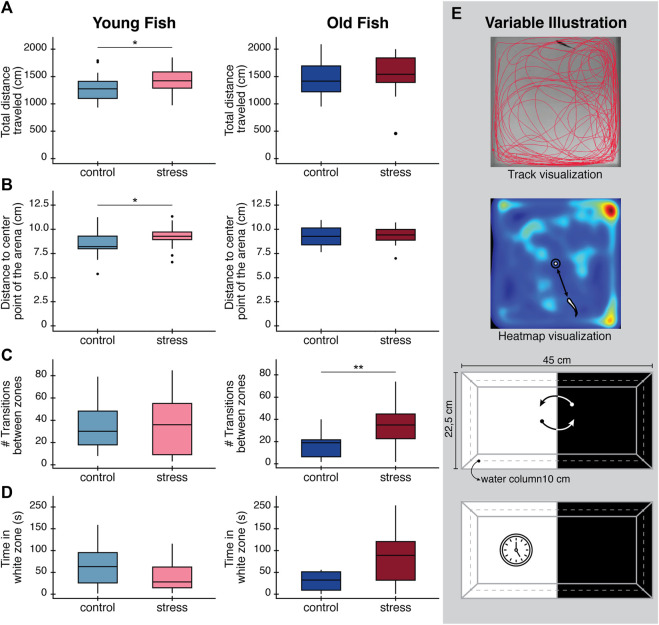
Effects in behavioral parameters (open field test and light/dark preference test) in zebrafish after exposure to a chronic stress protocol at day 9. (A) Total distance traveled in the open field test. (B) Distance to the center of the arena to evaluate thigmotaxis. (C) Total number of transitions between white and black zones during light/dark preference test. (D) Total time spent in the white zone of the tank during light/dark preference test as an exploratory behavior. Boxplots in panels (A–D), are drawn such that the upper and lower whiskers limit interquartile range (Q1, Q3) and the line represents the median (Q2). (E) Diagrams illustrating variable being measured in each case. Top: track visualization used to obtain the total distance traveled of zebrafish. Middle: heatmap visualization and how distance to the center point of the arena was defined. Bottom: Illustration of the number of transitions between the white and the black zones, and time spend in the white zone only. All results are expressed as the mean ± standard error of mean (S.E.M). Statistical analysis corresponds to Welch´s t-test. *p < 0.05; **p < 0.01; ***p < 0.001.

Acknowledgments
This image is the copyrighted work of the attributed author or publisher, and ZFIN has permission only to display this image to its users. Additional permissions should be obtained from the applicable author or publisher of the image. Full text @ Front. Physiol.