IMAGE

FIGURE 3

ID
ZDB-IMAGE-220518-26
Source
Figures for Henríquez Martínez et al., 2022
Image
Figure Caption

FIGURE 3

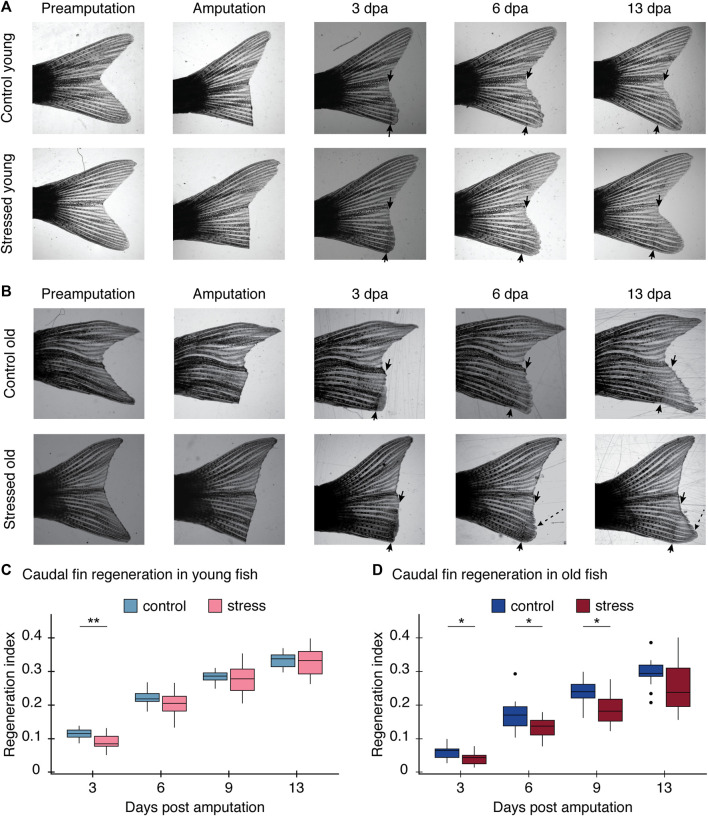
Regeneration process after the stress protocol. The regeneration index is calculated as the length of the regenerated tissue/initial length of the caudal fin of each fish measured from the most proximal part of the lepidotrichia. (A) Images of caudal fin growth measurements after amputation for young control fish (top row) and young stressed fish (bottom row). (B) Images of caudal fin growth measurements after amputation for old control fish (top row) and old stressed fish (bottom row). Black arrows indicate the amputation site. An additional measurement was done at 9 dpa but the image was excluded for clarity; complete regeneration process shown in Supplementary Figure S2 for young and Supplementary Figure S3 for old fish. Note heterogeneous growth in old fish (dashed line arrow). Further results on these unusual growth pattern can be seen in Supplementary Figure S4. (C) Graph comparing the regeneration index of the control and stress young caudal fin at 3, 6, 9, and 13 dpa; two cohorts included in this experiment. (D) Graph comparing the regeneration index of the control and stress old caudal fin at 3, 6, 9, and 13 dpa; two cohorts included in this experiment. All results are expressed as the mean ± standard error of mean (S.E.M). *p < 0.05; **p < 0.01; ***p < 0.001.

Acknowledgments
This image is the copyrighted work of the attributed author or publisher, and ZFIN has permission only to display this image to its users. Additional permissions should be obtained from the applicable author or publisher of the image. Full text @ Front. Physiol.