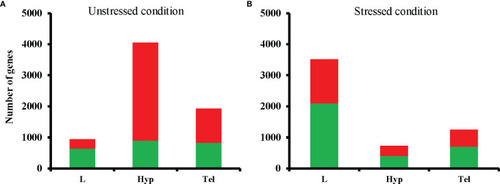
Total numbers of differentially expressed genes (DEGs) in fluoxetine-exposed groups compared to respective controls in unstressed (A) and stressed (B) conditions. The total numbers of DEGs are shown in a stacked format with downregulated and upregulated genes color-coded in green and red, respectively. L, larval head; Tel, telencephalon; Hyp, hypothalamus.

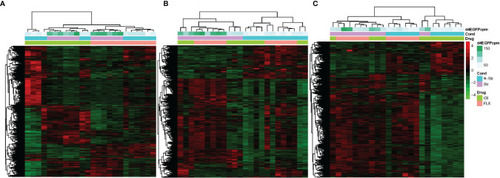
The effect of developmental fluoxetine exposure on transcriptome patterns in larval and adult male zebrafish central nervous system in the unstressed and stressed conditions. Hierarchical clustering (Spearman correlation) is shown for all 24 samples (stressed, unstressed, fluoxetine-exposed, and control ethanol-exposed) in a single pooled tissue sample (i.e., larval head, hypothalamus, and telencephalon) and their relation to FLX and stress. (A) FLX-exposed larvae compared to the control larvae. (B) telencephalon from adults exposed to FLX in the early life developmental stage compared to control adults exposed to vehicle compound (ethanol) in the early life developmental stage. (C) hypothalamus from adults exposed to FLX in the early life developmental stage compared to control adults exposed to vehicle compound (ethanol) in the early life developmental stage. The Y-axis consists of all genes with significant fold change (FDR ≤0.05 and FC≥ 1.2) in the treatment groups relative to the control groups. The count per million (CPM) of the reads associated with the green fluorescent protein (d4eGFP) transgene in the SR4G zebrafish line is shown. The different shades of green show different CPM. Red: up-regulation, green: down-regulation. Blue: unstressed condition, Lavender: stressed condition, Light Green: control (ethanol), Pink: Fluoxetine.

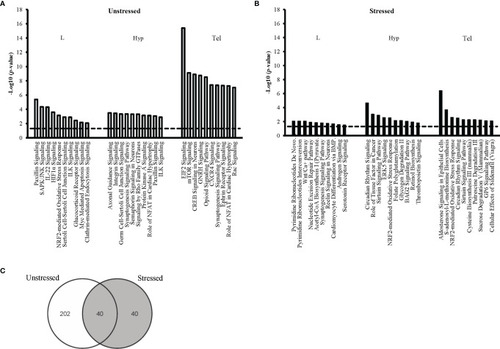
Top ten affected canonical pathways following early-life exposure to fluoxetine. The ten pathways with the highest level of significance (i.e. lowest p-value) for each target tissue are shown in larval heads (L), hypothalmus (Hyp), and telencephalon (Tel) in the unstressed (A) and the stressed (B) conditions. The y-axis presents the p-value associated with each pathway on a negative logarithmic scale (-log p-value). The horizontal dash line marks the negative logarithmic value related to the significance level p ≤0.05 [-log10(p)= 1.3]. Each bar shows a canonical pathway identified from the gene cluster enrichment function of IPA. The analysis was performed after converting the gene Ensembl ID of zebrafish (Danio rerio) to human (Homo sapiens) orthologues. Only genes with significant fold change (FC≥1.2; FDR ≤ 0.05) were used for pathway enrichment analysis. (C) The Venn diagram shows the number of all significantly affected pathways in all tissue samples from both the unstressed and the stressed conditions.

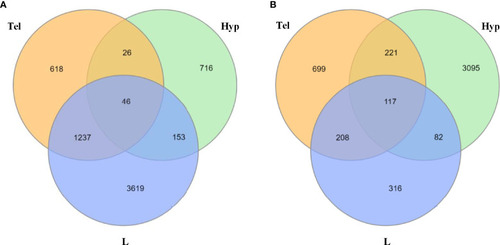
Number of common dysregulated genes in larvae and adult zebrafish upon developmental exposure to fluoxetine in stressed and unstressed conditions. (A) Venn diagram illustrating the common differentially expressed genes between larval heads and adult telencephalon and hypothalamus in the unstressed condition. (B) Venn diagram illustrating the common differentially expressed genes between larval heads and adult telencephalon and hypothalamus in the stressed condition. All of the significantly dysregulated genes (up or downregulated) were included in this comparison (FC≥1.2; p ≤ 0.05). L, larvae; Hyp, hypothalamus; Tel, telencephalon.

Acknowledgments
This image is the copyrighted work of the attributed author or publisher, and ZFIN has permission only to display this image to its users. Additional permissions should be obtained from the applicable author or publisher of the image. Full text @ Front Endocrinol (Lausanne)