
- Title
-
Effects of Zinc Ions Released From Ti-NW-Zn Surface on Osteogenesis and Angiogenesis In Vitro and in an In Vivo Zebrafish Model
- Authors
- Zhu, W.Q., Li, K., Su, S., Chen, W., Liu, Y., Qiu, J.
- Source
- Full text @ Front Bioeng Biotechnol
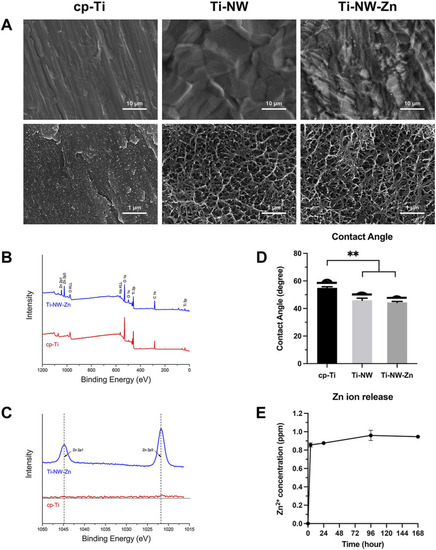
Surface characterization of different titanium surfaces. |
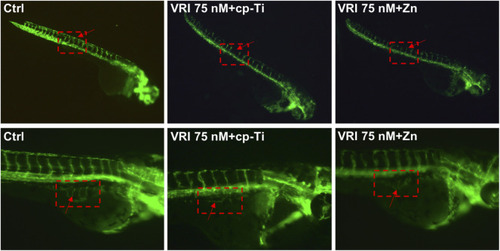
Angiogenesis of transgenic zebrafish in the group of control, cp-Ti, and Ti-NW-Zn. |
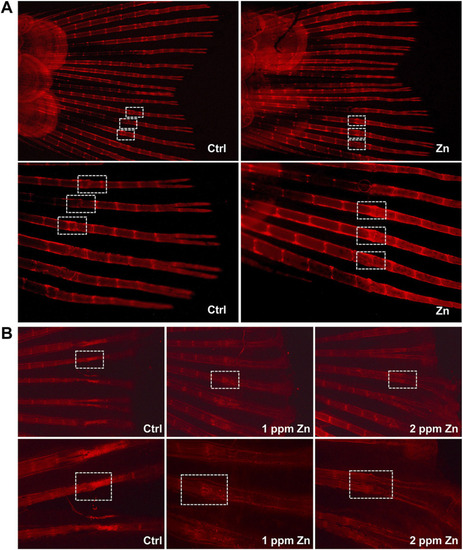
Zebrafish fin amputation and regeneration test. |
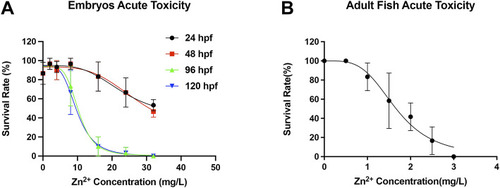
Survival rate in |
|

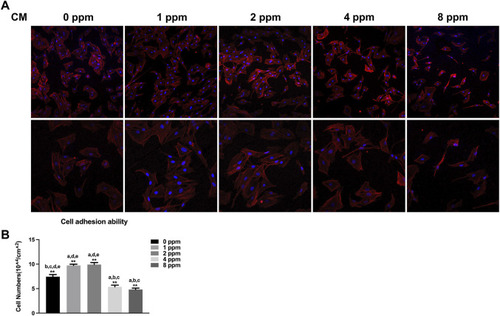
Cell adhesion ability assay. The adhesion ability of MC3T3-E1 cells was analyzed by counting the stained nuclei with DAPI using a confocal laser scanning microscope (CLSM) after incubation. |
Cell adhesion ability assay. The adhesion ability of MC3T3-E1 cells was analyzed by counting the stained nuclei with DAPI using a confocal laser scanning microscope (CLSM) after incubation. |
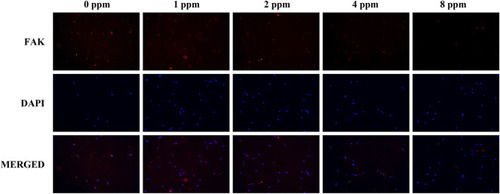
Immunolocalization of FAK (red) and nuclei (blue). The merged images show that the treatment of 1 and 2 ppm zinc ions promoted FAK expression significantly. All images are displayed at ×200 magnification. |
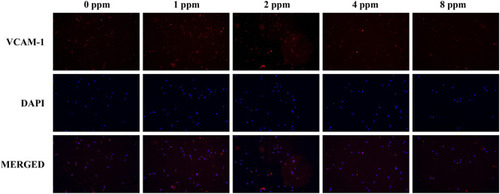
Immunolocalization of VCAM-1 (red) and nuclei (blue). The merged images show that the treatment of 1 and 2 ppm zinc ions promoted VCAM-1 expression significantly. All images are displayed at ×200 magnification. |
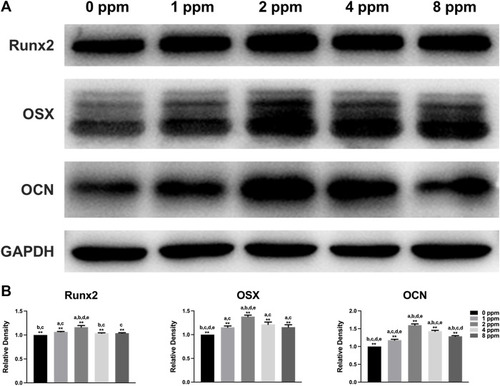
Protein expression levels of osteogenic markers Runx2, OSX, and OCN of osteoblast-like MC3T3-E1 cells in different concentrations of CM (Runx2, Runt-related transcription factor 2; OSX, osterix; OCN, osteocalcin). Quantification was performed by ImageJ software. Results are presented as mean ± SD (* |
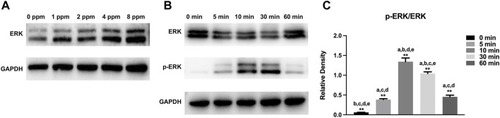
Activation of MAPK/ERK signaling by different concentrations of CM. |