IMAGE

FIGURE 1

ID
ZDB-IMAGE-220511-13
Source
Figures for Zhu et al., 2022
Image
Figure Caption

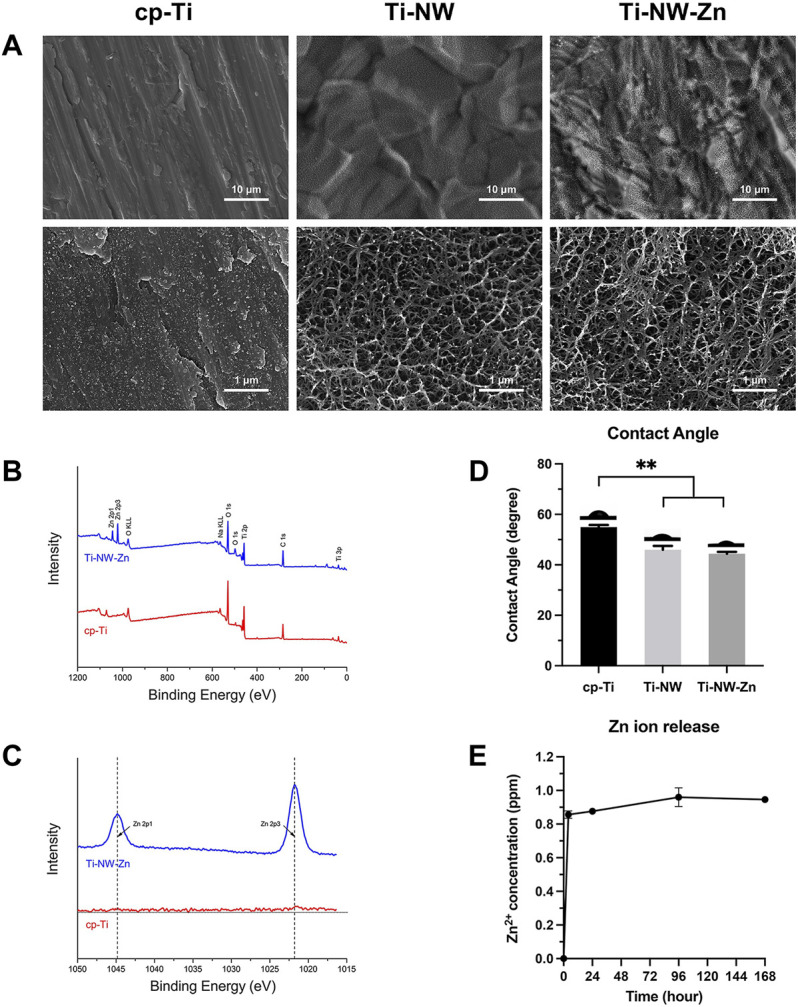
FIGURE 1

Surface characterization of different titanium surfaces. (A) SEM images of surface morphologies of cp-Ti, Ti-NW, and Ti-NW-Zn. Upper panel: ×5000 magnification. Lower panel: ×50000 magnification; (B) XPS wide scan spectra analysis of cp-Ti and Ti-NW-Zn surfaces; (C) XPS high-resolution spectra analysis of Zn 2p; (D) contact angles of cp-Ti, Ti-NW, and Ti-NW-Zn surfaces. Results were presented as mean ± SD (*p < 0.05, **p < 0.01; N = 3); (E) concentrations of Zn ion released from Ti-NW-Zn samples into PBS after 4 h and 1, 4, and 7 days; N = 3.

Acknowledgments
This image is the copyrighted work of the attributed author or publisher, and ZFIN has permission only to display this image to its users. Additional permissions should be obtained from the applicable author or publisher of the image. Full text @ Front Bioeng Biotechnol