
Image
|
Figure Caption
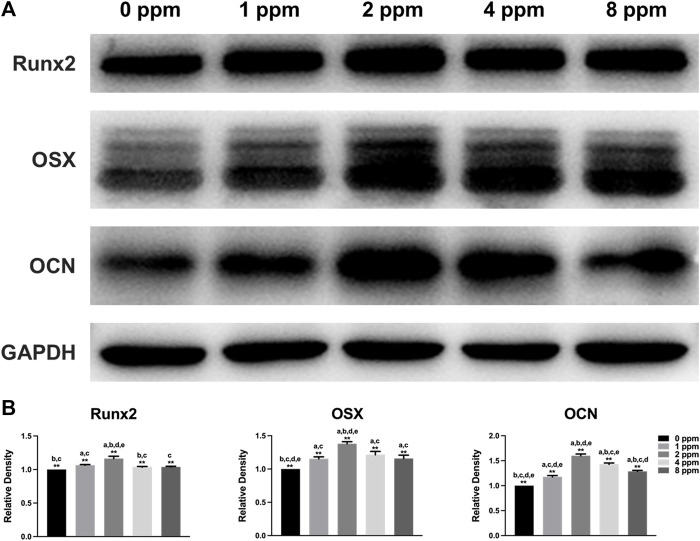
FIGURE 10
Protein expression levels of osteogenic markers Runx2, OSX, and OCN of osteoblast-like MC3T3-E1 cells in different concentrations of CM (Runx2, Runt-related transcription factor 2; OSX, osterix; OCN, osteocalcin). Quantification was performed by ImageJ software. Results are presented as mean ± SD (*
Acknowledgments
This image is the copyrighted work of the attributed author or publisher, and
ZFIN has permission only to display this image to its users.
Additional permissions should be obtained from the applicable author or publisher of the image.
Full text @ Front Bioeng Biotechnol