
- Title
-
Assessment of diphenhydramine toxicity - Is its mode of action conserved between human and zebrafish?
- Authors
- Barreto, A., Santos, J., Capitão, A., Eusébio, R., Pinheiro Damasceno, É., Luísa Machado, A., Rocha, L.S., Calisto, V., Amorim, M.J.B., Maria, V.L.
- Source
- Full text @ Environ. Int.
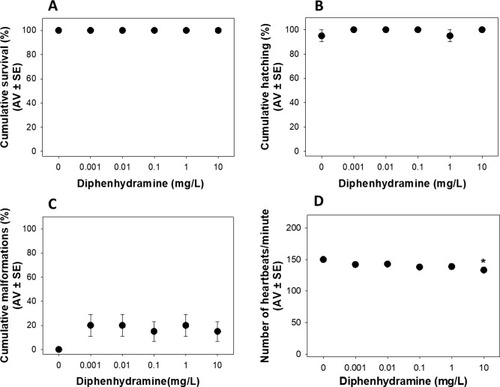
Fig. 1. Effects of 96 h diphenhydramine exposure on zebrafish embryos for survival (A); hatching (B); appearance of malformations (C); and heartbeat at 48 h (D). Data are expressed as average value (AV) ± standard error (SE) (n = 20). (*) Significant differences to control group (p < 0.05). 2-column fitting image. |
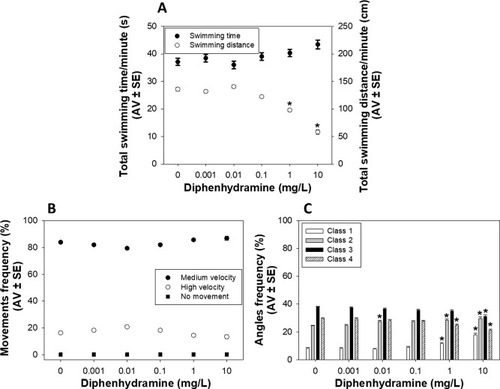
Fig. 2. Effects of 120 h diphenhydramine exposure on zebrafish larvae for total swimming time and distance (A); types of movements (B); and angles classes (C). Three types of movements were considered: no movement (0 mm/s); medium velocity (between 0 and 10 mm/s); and high velocity (above 10 mm/s). Four classes of angles were considered: class 1 – big amplitude angles (90-180°); classes 2 and 3 – medium amplitude angles (30-90° and 10-30°, respectively); and class 4 – small amplitude angles (0-10°). Data are expressed as average value (AV) ± standard error (SE) (n = 10). (*) Significant differences to control group (p < 0.05). These behavioral evaluations were considered for a period of 6 min of darkness. 2-column fitting image. |
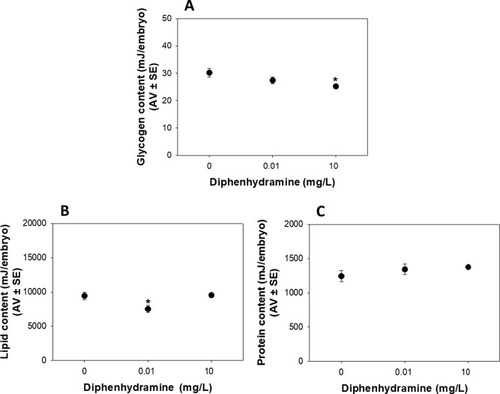
Fig. 3. Effects of 96 h diphenhydramine exposure on zebrafish larvae for carbohydrates (A); lipids (B); and proteins (C) contents. Data are expressed as average value (AV) ± standard error (SE) (n = 7). (*) Significant differences to control group (p < 0.05). 2-column fitting image. |
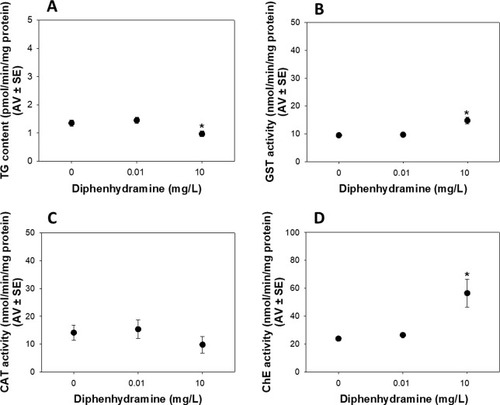
Fig. 4. Effects of 96 h diphenhydramine exposure on zebrafish larvae for total glutathione (TG) content (A); glutathione S-transferase (GST) (B); catalase (CAT) (C); and cholinesterase (ChE) (D) activities. Data are expressed as average value (AV) ± standard error (SE) (n = 7). (*) Significant differences to control group (p < 0.05). 2-column fitting image. |
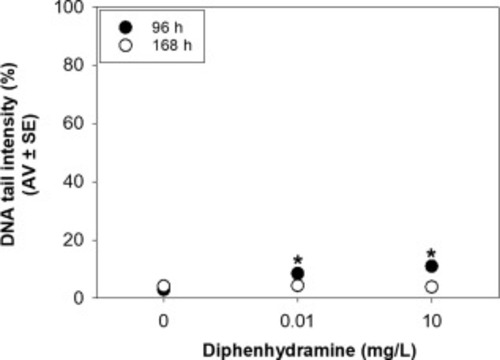
Fig. 5. Effects of 96 h diphenhydramine exposure and 168 h (96 h diphenhydramine exposure plus 72 h in clean media) on zebrafish larvae for DNA damage measured as DNA tail intensity. Data are expressed as average value (AV) ± standard error (SE) (n = 5). (*) Significant differences to control group (p < 0.05). Single. |
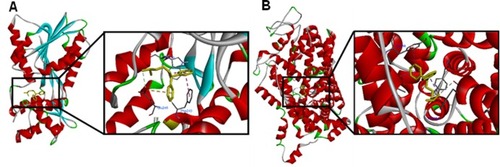
Fig. 6. Best predicted docking pose for diphenhydramine (yellow) with Danio rerio Hnmt (A) and Slc6a4a (B) (generated using AutoDock Vina). 2-column fitting image. (For interpretation of the references to colour in this figure legend, the reader is referred to the web version of this article.) |
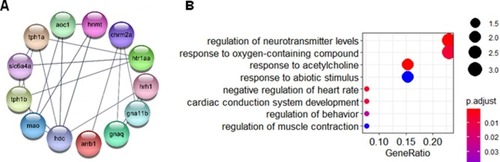
Fig. 7. STRING PPI-network using slc6a4a, chrm2a, hrh1 and hnmt as query (A) and dotplot of the biological process (B) retrieved from the enrichment analysis (Table S7) that were considered representative of the experimental in vivo results. 2-column fitting image. |