
Image
|
Figure Caption
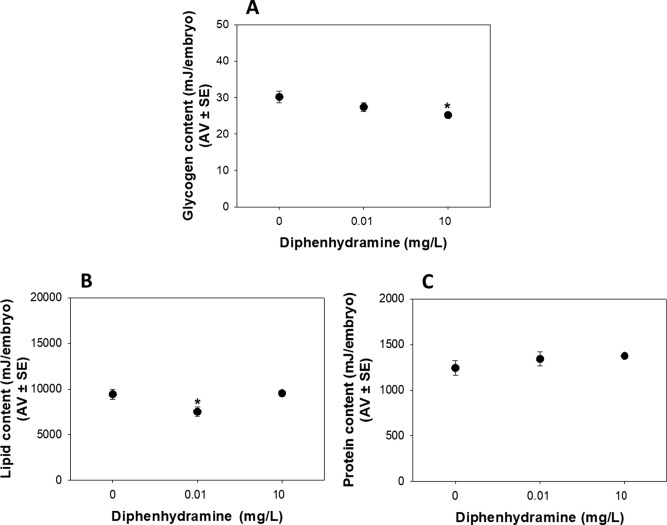
Fig. 3 Fig. 3. Effects of 96 h diphenhydramine exposure on zebrafish larvae for carbohydrates (A); lipids (B); and proteins (C) contents. Data are expressed as average value (AV) ± standard error (SE) (n = 7). (*) Significant differences to control group (p < 0.05). 2-column fitting image.
Acknowledgments
This image is the copyrighted work of the attributed author or publisher, and
ZFIN has permission only to display this image to its users.
Additional permissions should be obtained from the applicable author or publisher of the image.
Full text @ Environ. Int.