
Image
|
Figure Caption
Fig. 7
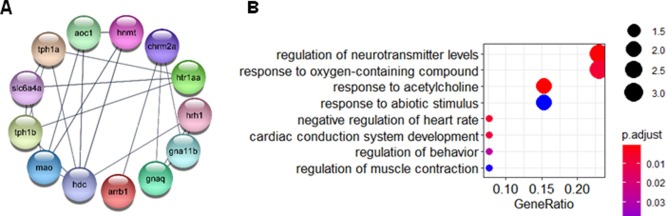
Fig. 7. STRING PPI-network using slc6a4a, chrm2a, hrh1 and hnmt as query (A) and dotplot of the biological process (B) retrieved from the enrichment analysis (Table S7) that were considered representative of the experimental in vivo results. 2-column fitting image.
Acknowledgments
This image is the copyrighted work of the attributed author or publisher, and
ZFIN has permission only to display this image to its users.
Additional permissions should be obtained from the applicable author or publisher of the image.
Full text @ Environ. Int.