
- Title
-
Different wild type strains of zebrafish show divergent susceptibility to TNBS-induced intestinal inflammation displaying distinct immune cell profiles
- Authors
- Padovani, B.N., Abrantes do Amaral, M., Fénero, C.M., Paredes, L.C., Boturra de Barros, G.J., Xavier, I.K., Hiyane, M.I., Ghirotto, B., Feijóo, C.G., Saraiva Câmara, N.O., Takiishi, T.
- Source
- Full text @ Curr Res Immunol
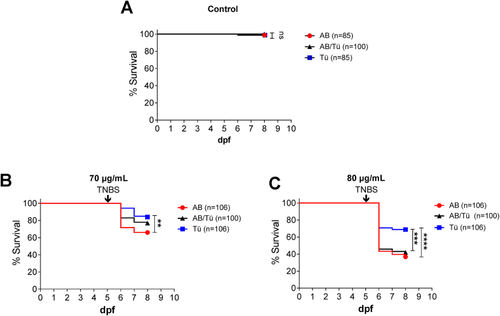
Survival comparison between AB, TU and AB/TU shows that TU presents a higher survival rate. At 3 days post-fertilization (dpf), 15–20 larvae were selected per group and placed in embryonic medium, then at 5 dpf, larvae were either kept in embryonic medium or TNBS was added to a final concentration of 70 μg/mL (T70) and 80 μg/mL (T80) and survival of larvae was followed up daily from 5 to 8 dpf. (A) No significant mortality was observed in the control group, ns = not significant. (B) In T70, survival of TU was significantly higher than AB and AB/TU presented intermediate mortality to AB and TU, **p = 0.0016. (C) In T80, survival of TU was significantly higher than AB and AB/TU, ****p < 0.0001, ***p = 0.0001, respectively. Differences were evaluated using the log-rank test (Mantel-Cox) test. Data is representative of the sum of four independent experiments. |
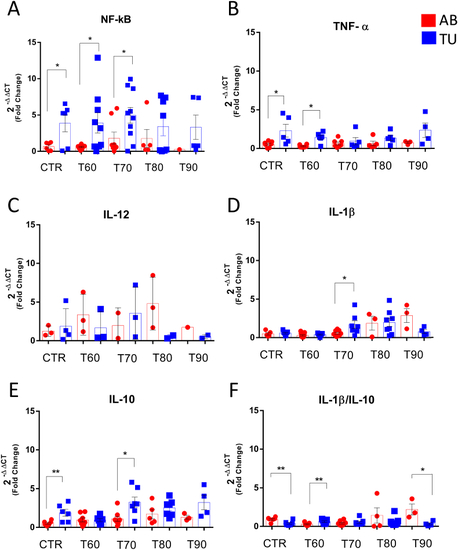
TU presents higher expression of genes regulating inflammation including NF-kB and IL-10. Control or larvae exposed to increasing doses of TNBS (T60-T90) were euthanized at 6 dpf, RNA was extracted, and real time PCR was performed. Relative gene expression was calculated using the 2(-ΔΔCT) method, using the elongation factor 1 - alpha (elf1-α) as internal control. (A) NF-kB expression was higher in TU compared to AB in CTR, T60 and T70, AB vs. TU, *P ≤ 0.05 (B) TNF- α was higher in TU in CTR and T60, AB vs. Tü; *P ≤ 0.05 (C) IL-12 analysis showed no significant differences between AB and TU (D) IL-1β expression significantly increased in TU after high exposure of TNBS (T70); AB vs. TU, *P ≤ 0.05. (E) IL-10 expression was generally more elevated in TU compared to AB in CTR and T70, *P ≤ 0.05, **P ≤ 0.01. (F) IL-1β/IL-10 ratio analysis showed higher ratio of IL-1β in AB compared to TU in control and T90, AB vs TU; *P ≤ 0.05, **P ≤ 0.01; however in T60, ratio was lower compared to AB CTR, **P ≤ 0.01. Each data point corresponds to 2–9 samples, each sample was obtained from a pool of 20 larvae. Data are presented as mean and standard error of mean and differences between AB and TU, or doses were calculated by unpaired t-student test. |
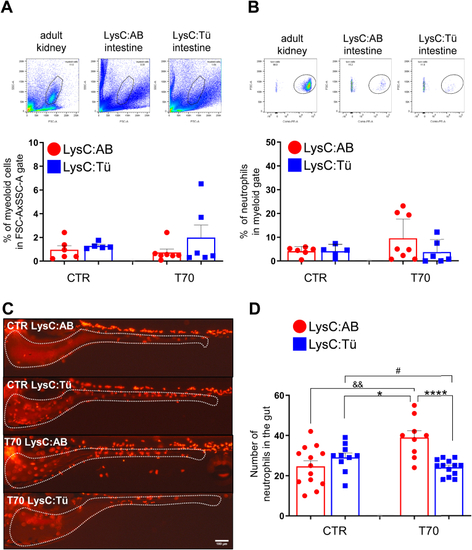
Neutrophils are increased in AB but not in TU after TNBS exposure. AB and TU were crossed with LysC;Dsred + zebrafish the Dsred + progeny was selected (LysC:AB and LysC:AB) and exposed to TNBS (T70). At 6 dpf analysis of intestinal immune cell infiltrate was analyzed by flow cytometry (A and B) or microscopy (C and D). For FACs analysis intestines of LysC:AB and LysC:AB were dissected and dissociated; (A) a gate on granulocytes was performed based on size and granularity and using cells isolated from the hematopoietic organ (kidney) of an adult zebrafish as reference and no significant differences between LysC:AB and LysC:TU was found; (B) the frequency of neutrophils (DsRed + cells) was unaltered in LysC:TU after TNBS exposure compared to control and in LysC:AB mean value increased compared to control but was not statistically significant. Each sample is a pool of 100–200 larval intestines, data is representative of three independent experiments. On another set of experiments, microscopic quantification of neutrophils in the gut of control or TNBS-exposed (T70) larvae was performed; (C) representative images of larvae showing delimitation of gut area (inside dotted lines) can be seen; (D) our data shows that in physiological conditions there are no differences between LysC:AB and LysC:TU and that TNBS exposure significantly increases the number of neutrophils in gut LysC:AB compared to control &&P ≤ 0.01 and vs. T70 LysC:TU, **P ≤ 0.01. In LysC:TU, TNBS caused a small but significant decrease in neutrophils compared to control #P ≤ 0.05. Each point represents 1 animal, for each group 9–13 animals were evaluated, data is representative of two independent experiments. Data are presented as mean and standard error of mean and differences were calculated by unpaired t-student test. |
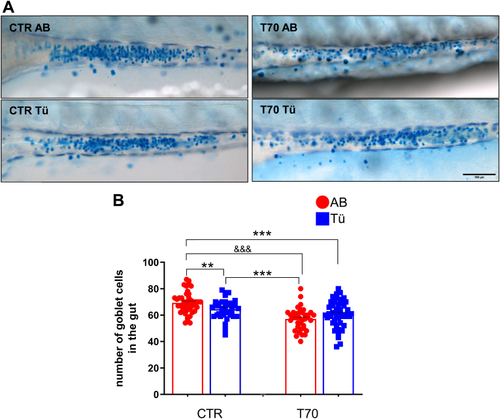
TNBS significantly reduces the number of mucus-producing goblet cells in AB but not TU. At 6dpf, control or larvae exposed to 70 μg/mL of TNBS (T70) were euthanized and stained with alcian blue to quantify mucus-producing goblet cells in the intestine. (A) representative images of mid intestinal region of larvae showing goblet cells stained in blue (B) Analysis of the number of goblet cells in the intestines show that in physiological conditions, AB presents a higher number of goblet cells compared to TU (CTR TU vs CTR AB; **P ≤ 0.01), however TNBS exposure causes a significant decrease in the number of goblet cells in AB larvae (CTR AB vs T70 AB &&&P ≤ 0.001), whilst in TU, TNBS does not cause alterations in the number of goblet cells. CTR AB vs. T70 TU, ***P ≤ 0.001; CTR TU vs. T70 AB, ***P ≤ 0.001. Data are presented as mean and standard error of mean and differences were calculated by unpaired t-student test. (For interpretation of the references to colour in this figure legend, the reader is referred to the Web version of this article.) |