
- Title
-
Coumarin-Palladium(II) Complex Acts as a Potent and Non-Toxic Anticancer Agent against Pancreatic Carcinoma Cells
- Authors
- Krstic, A., Pavic, A., Avdovic, E., Markovic, Z., Stevanovic, M., Petrovic, I.
- Source
- Full text @ Molecules

Figure 1. Schematic representation of the general procedure for the synthesis of complex Bis (3-(1-((3-hydroxyphenyl) amino)ethylidene) chroman-2,4-dione-palladium(II) complex (C1) obtained by reaction of 3-(1-(3-hydroxyphenyl)amino)ethylidene)chroman-2,4-dione (L1) and potassium tetrachloropalladate (II) (K2[PdCl4]). |
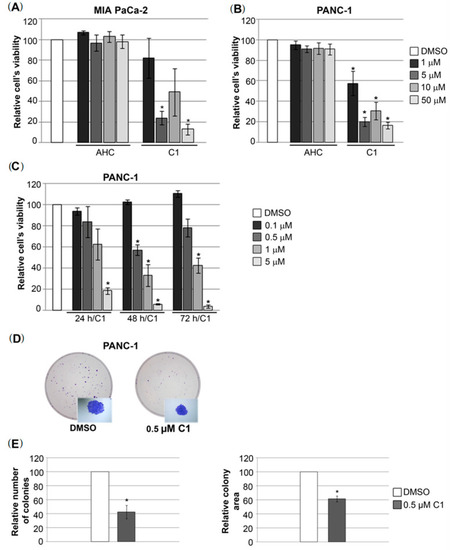
Figure 2. Effects of complex C1 on pancreatic carcinoma cells viability and potential to form colonies. (A) MIA-PaCa-2 cells were treated with DMSO as a vehicle, with various concentrations of initial compound, AHC and complex C1 for 24 h. The cell’s viability was calculated in relation to DMSO treated cell’s viability, which was set as 100%. Results were presented as the means ± SEM (standard error mean) of at least three independent experiments. Student’s t-test was used to calculate p-values (* p ≤ 0.05). (B) PANC-1 cells were treated with DMSO as a vehicle, various concentrations of initial compound, AHC and complex C1 for 24 h. The cell’s viability was calculated in relation to DMSO treated cell’s viability, which was set as 100%. Results were presented as the means ± SEM (standard error mean) of at least three independent experiments. Student’s t-test was used to calculate p-values (* p ≤ 0.05). (C) PANC-1 cells were treated with DMSO as a vehicle and with lower concentrations of complex C1 for 24 h, 48 h and 72 h. (D) Colony formation assay was performed on PANC-1 cells treated with DMSO as a vehicle or with 0.5 µM of complex C1 for a period of 10 days. Representative macroscopic images of colonies in Petri dish upon treatments are presented with corresponding microscopic images of colonies as an example at bottom right corners. Images were captured by digital camera. (E) Relative number of PANC-1 colonies and relative colony area were calculated in relation to these parameters measured in DMSO treated cells that were set as 100%. Results were presented as the means ± SEM of at least three independent experiments. Student’s t-test was used to calculate p-values (* p ≤ 0.05). |
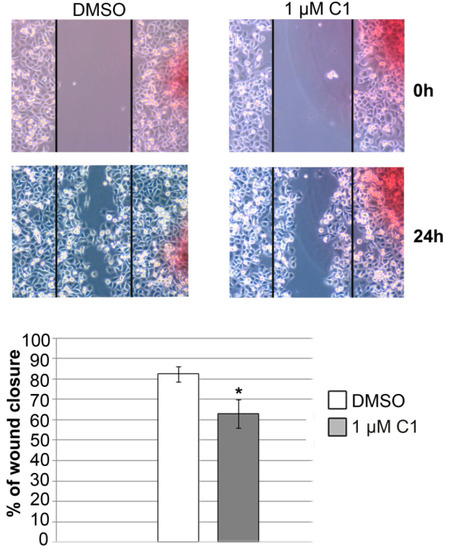
Figure 3. Effect of complex C1 on PANC-1 cell’s migratory potential. Cells were treated with DMSO or 1 µM complex C1, and scratch was made on 100% confluent cells in Petri dish. Gap was captured and measured after 0 h and 24 h (representative images are presented in upper panel). Cell migration was determined in 24 h time point by calculating percentage of wound closure compared to the gap width at 0 h that was set as 100%. Results were presented as the means ± SEM of at least three independent experiments. Student’s t-test was used to calculate p-values (* p ≤ 0.05). |
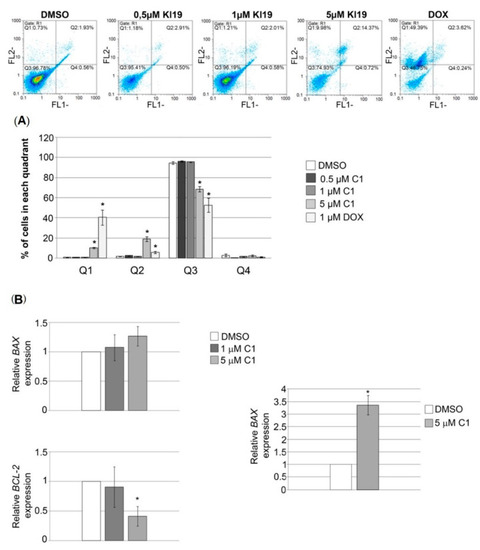
Pro-apoptotic effect of complex C1 on PANC-1 cells. ( |
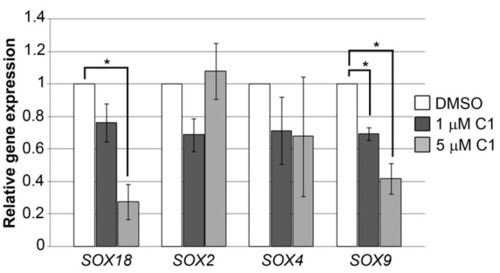
Figure 5. Effect of complex C1 on selected SOX genes expression. PANC-1 cells were treated with DMSO as a negative control and two concentrations of complex C1 (1 μM and 5 μM) and 24 h upon treatment cells were collected for RNA isolation followed by qRT-PCR. Relative expression of each SOX gene was calculated as a percentage of their expression in treated cells compared to their expression in cells treated with DMSO that was set as one. Results were presented as the means ± SEM of at least three independent experiments. Student’s t-test was used to calculate p-values (* p ≤ 0.05). |

Figure 6. Anticancer activity of complex C1 against human PANC-1 cells in zebrafish xenografts and in vivo hepatotoxicity test. Wt xenografts (n = 30 per treatment in each independent experiment) were exposed to complex C1 at doses 0.5 and 1 μM, and analyzed three days post injection. (A) Representative fluorescent microscopy images. The applied treatments markedly reduced the tumor growth. (B) Quantification of tumor growth reduction. The relative tumor growth in treated PANC-1 xenografts was calculated as a percentage of tumor growth in xenografts treated with DMSO that was set as 100%. Mean values are presented ± SEM and Student’s t-test was used to calculate p-values (* p ≤ 0.05). (C) Hepatotoxicity was assessed according to the liver fluorescence and size (D) Hepatotoxicity presented as a dot chart of the liver area index. Experiment was performed using 10 embryos per concentration. The liver area index was determined for five randomly selected embryos by ImageJ program. |