
|
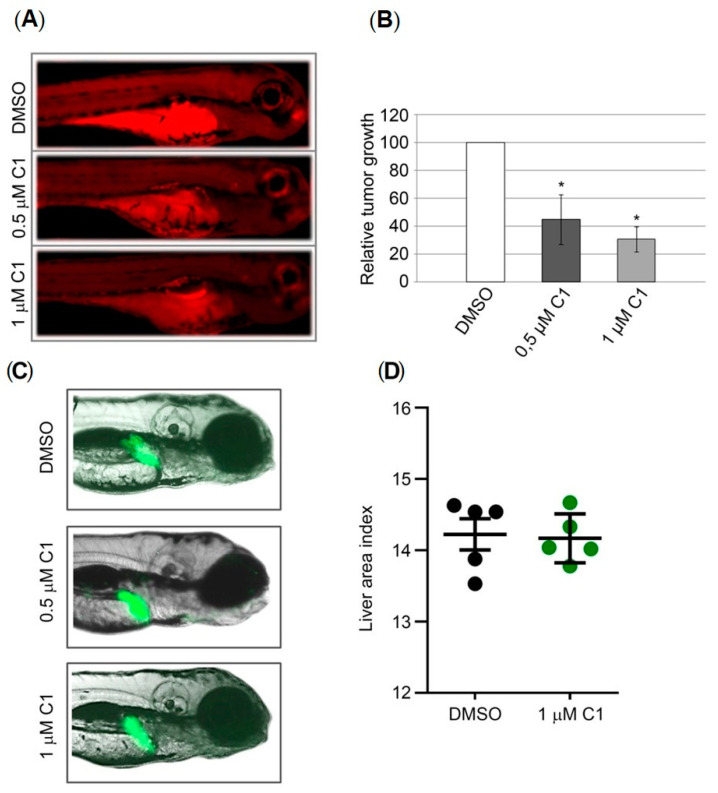
Figure 6 Figure 6. Anticancer activity of complex C1 against human PANC-1 cells in zebrafish xenografts and in vivo hepatotoxicity test. Wt xenografts (n = 30 per treatment in each independent experiment) were exposed to complex C1 at doses 0.5 and 1 μM, and analyzed three days post injection. (A) Representative fluorescent microscopy images. The applied treatments markedly reduced the tumor growth. (B) Quantification of tumor growth reduction. The relative tumor growth in treated PANC-1 xenografts was calculated as a percentage of tumor growth in xenografts treated with DMSO that was set as 100%. Mean values are presented ± SEM and Student’s t-test was used to calculate p-values (* p ≤ 0.05). (C) Hepatotoxicity was assessed according to the liver fluorescence and size (D) Hepatotoxicity presented as a dot chart of the liver area index. Experiment was performed using 10 embryos per concentration. The liver area index was determined for five randomly selected embryos by ImageJ program.