
Image
|
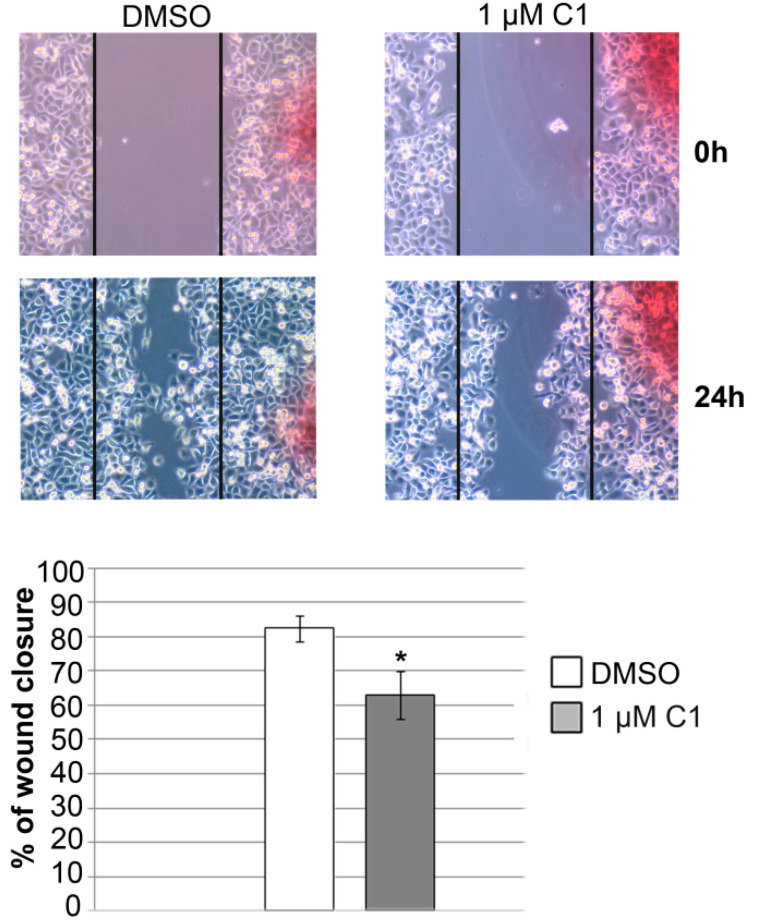
Figure Caption
Figure 3 Figure 3. Effect of complex C1 on PANC-1 cell’s migratory potential. Cells were treated with DMSO or 1 µM complex C1, and scratch was made on 100% confluent cells in Petri dish. Gap was captured and measured after 0 h and 24 h (representative images are presented in upper panel). Cell migration was determined in 24 h time point by calculating percentage of wound closure compared to the gap width at 0 h that was set as 100%. Results were presented as the means ± SEM of at least three independent experiments. Student’s t-test was used to calculate p-values (* p ≤ 0.05).
Acknowledgments
This image is the copyrighted work of the attributed author or publisher, and
ZFIN has permission only to display this image to its users.
Additional permissions should be obtained from the applicable author or publisher of the image.
Full text @ Molecules