FIGURE SUMMARY
Title

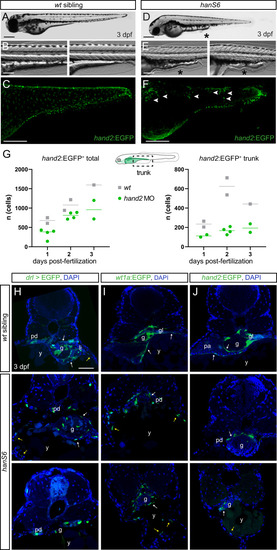
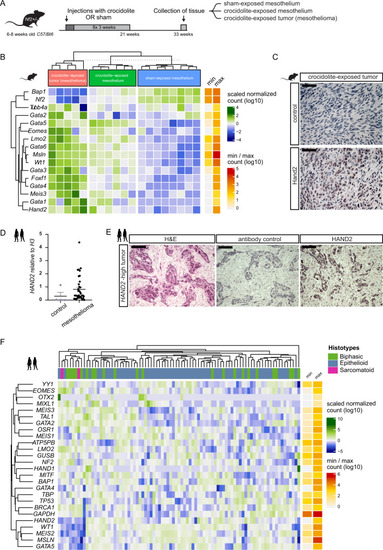
Hand2 delineates mesothelium progenitors and is reactivated in mesothelioma

Authors
Prummel, K.D., Crowell, H.L., Nieuwenhuize, S., Brombacher, E.C., Daetwyler, S., Soneson, C., Kresoja-Rakic, J., Kocere, A., Ronner, M., Ernst, A., Labbaf, Z., Clouthier, D.E., Firulli, A.B., Sánchez-Iranzo, H., Naganathan, S.R., O'Rourke, R., Raz, E., Mercader, N., Burger, A., Felley-Bosco, E., Huisken, J., Robinson, M.D., Mosimann, C.
Source
Full text @ Nat. Commun.

Visceral and parietal mesothelial layers in zebrafish are LPM lineages.

A Mesothelium in human versus zebrafish embryo. Transverse schematic of zebrafish embryo showing liver, gut, and budding swim bladder with associated mesothelium and smooth muscle at 3 dpf. B Tracing LPM using drl:creERT2 × hsp70l:Switch, 4-OHT administered at shield stage and washed off before 24 hpf. drl>EGFP indicates LPM lineage labeling. C Trunk section of drl lineage-traced 3 dpf embryo co-stained for smooth muscle (Tagln). Boxed regions show details of EGFP lineage-labeling and smooth muscle-labeling around gut (box I), swim bladder (box II), and liver ducts (box III). Arrows depict Tagln-negative;EGFP-positive cells, arrowheads depict Tagln;EGFP double-positive cells. D, E EGFP-based LPM labeling in the peritoneum around liver (D) and pancreas (E). F Rostral transverse section, lineage labeling of pericardium, ventricle (endocardium, myocardium, potentially epicardium (asterisk), blood), and LPM-derived and endoderm-derived organs in the head (head cartilage, vasculature, pharynx). G, H Sections of two regions along the anterior-posterior axis, G at yolk, H at yolk extension, showing drl-based LPM lineage labeling of parietal peritoneum forming body wall together with skin layer (boxed region). Pronephric duct (pd), liver (li), gut (g), swim bladder (sb), pancreas (pa), heart (h), blood vessel (bv), spinal cord (sc), pharynx (ph), and red blood cells (rbc). Nuclei in blue (DAPI). Scale bars CH 50 μm and 25 μm (boxed regions).

scRNA-sequencing of early LPM reveals a heterogeneous progenitor pool.

A LPM-marking drl:mCherry-positive cells of zebrafish embryos at tailbud stage, FACS-isolated, and sequenced using CEL-Seq2. B SPIM projection of drl:mCherry embryo at tailbud, labeling the LPM. C UMAP plot displaying 15 LPM cell clusters, colored by subpopulation: cardiopharyngeal (1,2), heart field, anterior vasculature, hemangioblasts/kidney (1,2), head mesoderm, hatching gland, hand2-high (1–4), and endoderm (1–3) as distinct group. D Approximate anterior-to-posterior orientation based on cdx4 (RNA ISH at 5 ss). E Dotplot including key cell fate markers to annotate clusters. Dots colored by column-scaled mean expression (log-transformed library-size-normalized counts) and sized by expression frequency (fraction of cells with non-zero counts); rows and clusters ordered by hierarchical clustering of scaled expression values. F UMAP plots of several genes co-expressed with hand2 or among cluster-determining genes in four hand2-high clusters. Cells colored by scaled expression values using lower/upper 1%-quantile boundaries. GK Whole-mount gene expression analysis of select transcripts enriched in hand2-high cells by fluorescent in situ hybridization (ISH) (G, H) and colorimetric mRNA ISH (IK). Fluorescent ISH of meis3 (G), foxh1 (H) with hand2 at 4 ss, revealing overlap in posterior LPM (magnified regions from dashed boxes). meis3 ISH at 10 ss (I), gata5 at 12 ss (J), and sfrp5 at 18 ss (K) showing expression in lateral-most LPM sprawling outwards (arrowheads). Scale bar G, H 100 μm, IK 250 μm.

<italic>hand2</italic> defines mesothelial precursors in the LPM.

A, B SPIM projections of hand2:EGFP;drl:mCherry embryos at 10 ss (A) and 16 ss (B). C Confocal imaging of 16 ss hand2:EGFP;drl:mCherry embryo showing hand2:EGFP-expressing cell populations comprising lateral-most LPM. Arrowheads label single-cell layer laterally migrating over yolk. Region as annotated in B. DF Transverse sections of 3 dpf hand2:EGFP embryos. D Boxed regions show double-positive Tagln staining (arrowheads) and Tagln-negative staining in visceral peritoneum around (I) gut, pancreatic/hepatic ducts (arrows), and (II) liver. Asterisk depicts a potential hepatic stellate cell. Ehand2:EGFP expression in visceral peritoneum surrounding the pancreas. F Transverse section of hand2:EGFP labeling of parietal peritoneum. G, H Abdominal transverse sections of E14.5 Hand1EGFPCreΔNeo/+;R26R and E15.5 Hand2Cre;R26R mouse embryos, lineage-labeled cells marked by β-galactosidase staining (blue). In both groups, lineage labeling appears in the visceral peritoneum of the liver (arrowheads). I, Jwt1a:EGFP (I) and wt1b:EGFP (J) expression in pronephric ducts and visceral peritoneum surrounding the gut, swim bladder, and liver. Boxed regions show double-positive Tagln staining (arrowheads) and Tagln-negative staining (arrows). Body wall (bw), diaphragm (d), gut (g), liver (li), pronephric duct (pd), swim bladder (sb). Nuclei in blue (DAPI). Scale bars D, F, I, J 50 μm, E, boxed regions D, F, I, J 25 μm, and G, H 100 μm.

Primordial germ cells migrate with, and home within, the <italic>hand2</italic>-positive LPM.

A UMAP plots of cxcl12a, hand2, and pax2a. Cells are colored by scaled expression values using lower and upper 1%-quantiles as boundaries. B, C Snapshots of time-lapse movie (Supplementary Movie 1) showing drl:EGFP with primordial germ cell (PGC) marker mCherry-f-nos3UTR, with 3D renderings at 60% epiboly, 1 ss, and 10 ss (B) and maximum intensity Mercator projections for the same time points (C). The PGCs migrate from four different clusters during gastrulation into two bilateral clusters during somitogenesis (boxed regions). Note the sparse (lost) PGCs located within the endoderm (asterisks). Animal side is for 60% epiboly to the top, anterior for 1 ss and 10 ss (B) to the top and (C) to the left. D Imaging of hand2:EGFP with mCherry-f-nos3UTR showing a dorsal view at 24 hpf: the PGC clusters fall completely within the hand2:EGFP domain. The outlines of the yolk extension are highlighted. E Segmented 3D rendering of a hand2:EGFP; mCherry-f-nos3UTR double-positive embryo stained with anti-Pax2a (yellow) and DAPI (blue) at 28 hpf. F A schematic transverse section of a 24 hpf embryo showing two bilateral PGC clusters (magenta) lateral of the developing gut, ventral-lateral of the Pax2a-positive developing pronephros (yellow) within the cxcl12a-high hand2-positive LPM/coelomic epithelium (green). Scale bar D, E 250 μm.

Formation of the <italic>hand2</italic>-positive mesothelium.

Multiday, multi-angle SPIM of hand2:EGFP zebrafish embryos from 18 to 82 hpf (n = 6). A Maximum intensity projection (MAX) of embryo expressing the LPM-marking drl:mCherry (24 hpf onwards restricted to cardiovascular lineages) (magenta) and hand2:EGFP (greyscale) at 48 hpf. Boxes depict selected regions in CG. Bhand2:EGFP-positive populations within 48 hpf embryo, lateral view left and dorsal view right. CE 3D-rendered hand2:EGFP embryo, focused on pericardium formation. C Rostral view, visualizing formation of pharyngeal arches (asterisks) and primary heart tube. D Ventral view, illustrating left and right flanks of the forming pericardium meeting at the midline (32 hpf, arrowheads). E Single plane, highlighting how the pericardial cavity forms within anterior LPM (arrows). hand2:EGFP labels coelomic epithelium, contributing to ventral and dorsal pericardium. F, G Single-plane cross-sections showing the migration of hand2-positive cells over yolk (G) and yolk extension (H), forming parietal peritoneum. Yellow arrows point out dorsal-ventral directed migration path. White arrows indicate inwards-migrating EGFP-expressing cells, contributing to coelomic epithelium maturing into visceral peritoneum. H Schematics of how hand2-expressing cells laterally migrate over the yolk forming parietal peritoneum, and migrating medially to wrap around endodermal-derived organs forming the visceral peritoneum. Red blood cells (rbc), heart tube (ht), pharyngeal arches (pa), and yolk (y). Scale bars A, B 500 μm and CG 25 μm.

Loss of <italic>hand2</italic> causes peritoneum defects.

AE Lateral views of phenotypically wildtype AC zebrafish embryos and representative hanS6 mutants (DF) at 3 dpf. Note the abnormal phenotype of the yolk extension (representative reference wildtypes in B) in hanS6 mutant embryos (asterisks in D, E); the increasing autofluorescence of the ventral yolk is possibly caused by the progressive disorganization of the yolk tissue. SPIM-based live imaging of hand2:EGFP transgene expression that depicts mesothelial progenitors over the posterior yolk and yolk extension (wildtype reference in C) documents disorganized and only partially migrated mesothelial progenitors (arrowheads in F). G Quantification of hand2:EGFP-expressing cells in wildtype versus hand2 MO-injected embryos (morphants) over time (days post-fertilization). The left graph depicts the total amount of hand2:EGFP+ cells in an embryo (including heart and pectoral fin field), the right graph the hand2:EGFP+ in the trunk region (boxed area in schematic). See Supplementary Fig. 8 for Imaris analysis. Source data are provided as a Source Data file. HJhanS6 in the background of drl:creERT2;hsp70l:Switch (H), wt1a:EGFP (I), and hand2:EGFP (J). Visceral peritoneum is disorganized around the internal organs (pointed out with white arrows) and the body wall and the associated parietal peritoneum are malformed (pointed out with yellow arrows) in hanS6 mutants compared to wildtype controls. Gut (g), liver (li), pancreas (pa), pronephric duct (pd), and yolk (y). Nuclei in blue (DAPI). Scale bars A, D 250 μm, B, C, E, F 125 μm, and HJ 50 μm.

Mesothelioma reactivates an early LPM program.

A Modeling loss of mesothelial homeostasis during mesothelioma tumorigenesis: 6–8 weeks-old Nf2+/− C57Bl/6J mice exposed to crocidolite intra-peritoneally (400 µg) every 3 weeks with eight total treatments, parallel to controls. 33 weeks after initial exposure, tissue was collected. B Heatmap of LPM-associated genes, either upregulated (Msln, Wt1) or downregulated (Nf2, Bap1) mesothelioma genes, and negative control (Tubb4a). Bins colored by row-scaled log2-normalized counts; columns (samples) split by treatment group; rows and columns ordered by hierarchical clustering (scaled expression values). Right side row indicates raw count range. C Immunoreactivity of Hand2 protein in mouse mesothelioma. D Relative expression of HAND2 by qPCR in normal pleura (n = 4) and human malignant mesothelioma (n = 36); trend (p = 0.0596) towards increased HAND2 levels in tumors (Mann–Whitney two-tailed test, exact p-value). Mean ± SE. E Immunoreactivity of HAND2 protein in HAND2-high human mesothelioma. F Heatmap representing unsupervised hierarchical clustering of human mesothelioma from TCGA RNA-seq (n = 87), depicting expression of mesothelial progenitor-associated LPM genes, mesothelioma-associated genes (WT1, MSLN, BAP1, NF2, and TP53), unrelated control (YY1, OTX2, and BRCA1) and housekeeping genes (ATP5PB, GUSB, TBP, and GAPDH). Columns represent histotypes, rows represent log10-transformed, batch-normalized mRNA expression levels of mesothelioma samples. Scale bars C 50 µm, and D 100 µm.

Acknowledgments
This image is the copyrighted work of the attributed author or publisher, and ZFIN has permission only to display this image to its users. Additional permissions should be obtained from the applicable author or publisher of the image. Full text @ Nat. Commun.