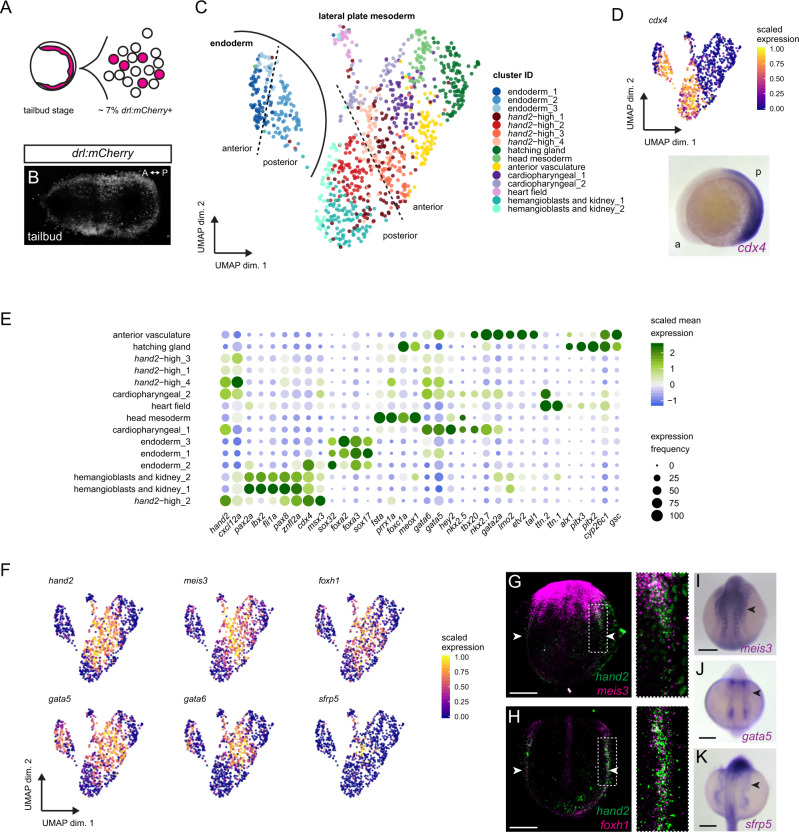
IMAGE

Fig. 2

ID
ZDB-IMAGE-220422-16
Source
Figures for Prummel et al., 2022
Image
Figure Caption

Fig. 2 scRNA-sequencing of early LPM reveals a heterogeneous progenitor pool.

A LPM-marking drl:mCherry-positive cells of zebrafish embryos at tailbud stage, FACS-isolated, and sequenced using CEL-Seq2. B SPIM projection of drl:mCherry embryo at tailbud, labeling the LPM. C UMAP plot displaying 15 LPM cell clusters, colored by subpopulation: cardiopharyngeal (1,2), heart field, anterior vasculature, hemangioblasts/kidney (1,2), head mesoderm, hatching gland, hand2-high (1–4), and endoderm (1–3) as distinct group. D Approximate anterior-to-posterior orientation based on cdx4 (RNA ISH at 5 ss). E Dotplot including key cell fate markers to annotate clusters. Dots colored by column-scaled mean expression (log-transformed library-size-normalized counts) and sized by expression frequency (fraction of cells with non-zero counts); rows and clusters ordered by hierarchical clustering of scaled expression values. F UMAP plots of several genes co-expressed with hand2 or among cluster-determining genes in four hand2-high clusters. Cells colored by scaled expression values using lower/upper 1%-quantile boundaries. GK Whole-mount gene expression analysis of select transcripts enriched in hand2-high cells by fluorescent in situ hybridization (ISH) (G, H) and colorimetric mRNA ISH (IK). Fluorescent ISH of meis3 (G), foxh1 (H) with hand2 at 4 ss, revealing overlap in posterior LPM (magnified regions from dashed boxes). meis3 ISH at 10 ss (I), gata5 at 12 ss (J), and sfrp5 at 18 ss (K) showing expression in lateral-most LPM sprawling outwards (arrowheads). Scale bar G, H 100 μm, IK 250 μm.

Acknowledgments
This image is the copyrighted work of the attributed author or publisher, and ZFIN has permission only to display this image to its users. Additional permissions should be obtained from the applicable author or publisher of the image. Full text @ Nat. Commun.