
- Title
-
5' Half of specific tRNAs feeds back to promote corresponding tRNA gene transcription in vertebrate embryos
- Authors
- Chen, L., Xu, W., Liu, K., Jiang, Z., Han, Y., Jin, H., Zhang, L., Shen, W., Jia, S., Sun, Q., Meng, A.
- Source
- Full text @ Sci Adv

Identification and expression analysis of tRNAFs.
(A) Principle of small RNA pretreatments for library construction. Only tRNAFs are shown. P, phosphate group; cP, 2′3′-cyclic phosphate group; OH, hydroxyl group; ATP, adenosine 5′-triphosphate. (B) Proportion of different types of small RNAs in zebrafish embryos. Small RNAs were aligned to different databases, and the unknown types were mapped to the genome. lncRNA, long noncoding RNA. (C) Percentages of different types of tRNAFs based on their cleavage sites, showing the dominance of long 5′tRFls. (D) Percentages of different 5′tRFls based on their original isoacceptors or isodecoders. (E) Percentages of full-length tRNAs. (F) RT-qPCR verification of 5′tRFlGly/GCC and 5′tRFlGlu/CTC expression levels from 1c to shield stage. Expression levels at later stages were normalized to that at the 1c stage. (G and H) Northern blot verification of 5′tRFlGly/GCC (G) and 5′tRFlGlu/CTC (H) expression levels from 1c to shield stage. Left: GelSafe staining of urea polyacrylamide gel electrophoresis (PAGE) gel with indicated full-length tRNA and 5′tRFl positions. Middle: Northern blot detected by locked nucleic acid (LNA) probe against tRNA/5′tRFlGly/GCC (G) or tRNA/5′tRFlGlu/CTC (H). Right: Average 5′tRFl level with ±SD from three independent experiments. *P < 0.05; **P < 0.01; ***P < 0.001; ****P < 0.0001 (Student’s t test, two-tailed). |
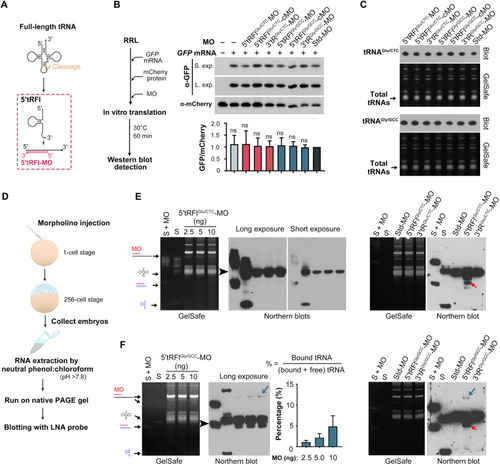
Specificity of 5′tRFl complementary antisense MOs.
(A) Illustration of 5′tRFl-MO target region. (B) 5′tRFlGly/GCC and 5′tRFlGlu/CTC MOs did not affect translation activity in the RRL in vitro translation system. Left: The experimental procedure. The synthesized and exogenous proteins were immunoblotted with anti-GFP and anti-mCherry antibody, respectively. Right top: Western blot results with short exposure (S. exp) or long exposure (L. exp). Bottom: The relative GFP/mCherry ratio quantified from band intensity. Data are shown in averages with ±SD from three independent experiments. ns, nonsignificant with P > 0.05 (Student’s t test, two-tailed). (C) Northern blot results of tRNAGlu/CTC (top) and tRNAGly/GCC (bottom) from the RRL system with the addition of different MOs using antisense LNA probes. (D) Experimental procedure for detection of the tRNA/MO complex by Northern blotting. (E and F) Estimation of MO binding capacity in vivo with tRNAGlu/CTC (E) or tRNAGly/GCC (F). Each blot was subjected to short or/and long exposure after hybridization. S, 1.2 ng of in vitro synthesized full-length tRNA and 1.2 ng of 5′tRFl-mimetic that were directly loaded onto gel; S + MO, preannealed synthetic tRNA (1.2 ng)/5′tRFl (1.2 ng) and MO (1.5 ng); other lanes in right, MO injection at 10 ng per embryo. The possible composition of each band after GelSafe staining is indicated by arrows. Note that 5′tRFlGlu/CTC-MO/tRNAGlu/CTC was undetectable, suggesting that they do not bind to each other. Weak 5′tRFlGly/GCC-MO/tRNAGly/GCC complex (indicated by a blue arrow) was detected and is quantified in the bar graph on the left. 5′tRFlGly/GCC/5′tRFlGly/GCC-MO or 5′tRFlGlu/CTC/5′tRFlGlu/CTC-MO complex is indicated by a red arrow. |

Knockdown of 5′tRFlGlu/CTC or 5′tRFlGly/GCC leads to early embryonic lethality.
(A) Knockdown effect of 5′tRFlGlu/CTC and 5′tRFlGly/GCC. The binding region of MO in 5′tRFl is illustrated on top. All embryos were laterally viewed. The ratio of representative embryos was indicated on the right bottom. Note that 5′tRFlGly/GCC morphants could not develop beyond the shield stage, and most 5′tRFlGlu/CTC morphants died right after the bud stage. (B) Mismatch control MOs induced no obvious phenotype. The complementarity of cMO to 5′tRFl is illustrated on top. (C) Dose-dependent effects of 5′tRFlGlu/CTC-MO (top) and 5′tRFlGly/GCC-MO (bottom) on embryonic development. Normal embryos were those that had no obvious morphological defects. n, embryo number at the start of observation. (D) Injection of 3′tRGlu/CTC-MO or 3′tRGly/GCC-MO leads to no obvious phenotype. The binding region of 3′tR-MOs is illustrated on top. (E) Puromycin-incorporated nascent proteins are reduced in 5′tRFlGlu/CTC or 5′tRFlGly/GCC morphants. Left: Experimental procedure. Purified GFP protein injected at 6 ng per embryo served as an internal control. Right top: Western blot results at indicated stages using anti-puromycin or anti-GFP antibody. Molecular weight markers are shown on the right side. CHX, cycloheximide, a translation inhibitor. Right bottom: Relative puromycin/GFP ratio normalized to that in the Std-MO group. Data are shown in averages with ±SD from three independent experiments. ns, nonsignificant with P > 0.05; ***P < 0.001; ****P < 0.0001 (Student’s t test, two-tailed). Scale bars, 100 μm (for zebrafish embryos). |
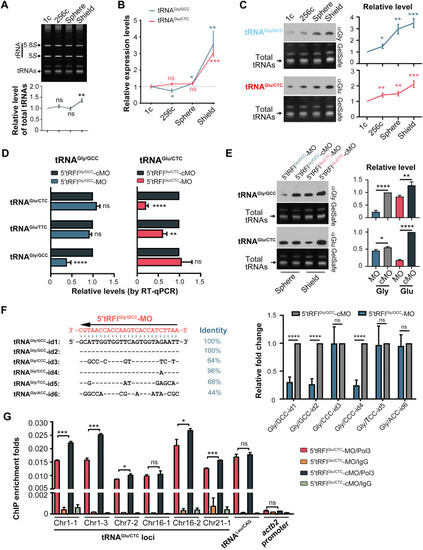
Loss of 5′tRFlGlu/CTC and 5′tRFlGly/GCC impairs normal tRNA gene transcription.
(A) Dynamics of total tRNAs during early embryogenesis. (B and C) Dynamics of full-length tRNAGly/GCC and tRNAGlu/CTC levels during early embryogenesis. Their levels were detected by both RT-qPCR (B) and Northern blot (C). The RT-qPCR values were normalized to that at the 1c stage. (C) Left: Northern blot and gel staining results. (C) Right: Relative level of tRNAGly/GCC and tRNAGlu/CTC based on the band intensity on the blot that was normalized to the average intensity of 5S and 5.8S rRNAs on gel. (D and E) Knockdown of 5′tRFlGly/GCC and 5′tRFlGlu/CTC down-regulates the level of related tRNA. Embryos at the 1c stage were injected with 10 ng of MO and collected at indicated stages for RT-qPCR (D) or Northern blot (E) as described in (B) and (C). (F) Effect of 5′tRFlGly/GCC-MO injection on the expression of different tRNAGly isoacceptors/isodecoders (id) with divergent sequences. Left: Sequence comparison among different tRNAGly in the 5′tRFlGly/GCC-MO targeting sequence. The identical nucleotides are indicated by “-”. Note that tRNAGly/GCC-id1 and tRNAGly/GCC-id2 have different nucleotides in the remaining part (as shown by the primers in table S3) of tRNA sequence. Right: Expression levels of indicated tRNAGly. 1c stage embryos were injected with 10 ng of MO per embryo and collected at the sphere stage for RT-qPCR analysis. (G) ChIP-qPCR results showing a reduction of Polr3a binding to tRNAGlu/CTC genes in 5′tRFlGlu/CTC morphants. 1c stage embryos were injected with 10 ng of 5′tRFlGlu/CTC-MO or 5′tRFlGlu/CTC-cMO and harvested at 6 to 8 hpf for ChIP assay using Polr3a antibody or immunoglobulin G (IgG). The immunoprecipitated DNA was used for amplifying the indicated loci using specific primers. Data are shown as averages with ±SD from three independent experiments. ns, nonsignificant with P > 0.05; *P < 0.05; **P < 0.01; ***P < 0.001; ****P < 0.0001 (Student’s t test, two-tailed). |

5′tRFlGlu/CTC and 5′tRFlGly/GCC promote related tRNA gene transcription.
(A) Injection of 5′tRFlGlu/CTC or 5′tRFlGly/GCC-mimetics leads to no obvious defects till 36 hpf. Scale bar, 100 μm. (B and C) 5′tRFlGly/GCC and 5′tRFlGlu/CTC positively regulate related tRNA levels. Embryos at the 1c stage were injected with 0.6 pmol of RNA oligo and collected at the 256c stage for RT-qPCR (B) or Northern blot (C) as described in Fig. 4 (B and C). (D) Illustration of in vitro tRNA gene transcription system (ivTGTS). The upstream sequences (red line) and transcription sequences (green box) of three tRNAGlu/CTC loci were used to construct reporter plasmids by each fusing to the artificial reporter sequence F30-Broccoli (F30-Br). TSS, transcription start site; TTS, transcription termination site. (E) Effectiveness test of F30-Broccoli reporter transcription in ivTGTS by RT-PCR. Presynthesized GFP mRNA was added to serve as an exogenous reference. (F and G) Effect of 5′tRFlGlu/CTC-mimetic (F) or 5′tRFlGlu/CTC-MO (G) on F30-Broccoli reporter transcription in ivTGTS. Doses (per reaction): 1 μg of DNA mix; MO, 1 μg; RNA oligos, 60 pmol. For all experiments in this figure, data are shown in average with ±SD from three independent experiments. ns, nonsignificant with P > 0.05; **P < 0.01; ***P < 0.001; ****P < 0.0001 (Student’s t test, two-tailed). |
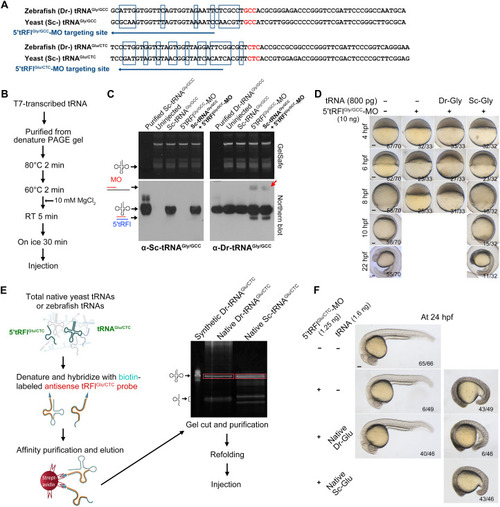
Supply of exogenous tRNAs alleviates knockdown effect of 5′tRFlGly/GCC or 5′tRFlGlu/CTC in zebrafish embryos.
(A) Sequence comparison between zebrafish (Danio rerio, Dr) and yeast (Saccharomyces cerevisiae, Sc) tRNAGly/GCC or tRNAGlu/CTC. The mismatched bases are boxed. The MO-targeted sequences are indicated by arrows. (B) Procedures for in vitro tRNA transcription using the T7 RNA polymerase and subsequent purification and refolding. RT, room temperature. (C) Disability of 5′tRFlGly/GCC-MO binding to Sc-tRNAGly/GCC in zebrafish embryos as detected by Northern blotting. Ten nanograms of 5′tRFlGly/GCC-MO and/or 800 pg of tRNAGly/GCC (per embryo) was injected into 1c stage embryos, and embryos were harvested at 2.5 hpf for extraction of total RNAs. Synthetic tRNAGly/GCC was directly loaded onto the gel, serving as molecular markers. RNAs on blots were probed using digoxigenin-labeled antisense Sc-tRNAGly/GCC oligo (left bottom) or antisense Dr-tRNAGly/GCC-LNA oligo (right bottom). The endogenous Dr-tRNAGly/GCC/5′tRFlGly/GCC-MO complex is indicated by a red arrow (right bottom). (D) Sc-tRNAGly/GCC rescues the lethal phenotype of 5′tRFl Gly/GCC morphants. (E) Procedure for isolation of native Dr-tRNAGlu/CTC and Sc-tRNAGlu/CTC. The starting material was purchased yeast crude tRNA extracts or total tRNAs extracted from zebrafish embryos. Biotin-labeled antisense Sc-tRNAGlu/CTC or Dr-tRNAGlu/CTC oligo was used to pull-down specific tRNAGlu/CTC molecules, which were enriched by streptavidin beads. The isolated tRNAGlu/CTC molecules were subjected to gel separation, gel cut (boxed), elution, and refolding. (F) Effective rescue of 5′tRFlGlu/CTC morphants by native Dr-tRNAGlu/CTC but not Sc-tRNAGlu/CTC. 5′tRFlGlu/CTC-MO (1.25 ng per embryo) alone or together with purified native Dr- or Sc-tRNAGlu/CTC (1.6 ng per embryo) was injected into 1c stage embryos, followed by morphological observation at 24 hpf. The ratio of embryos with the representative morphology is indicated. Scale bars, 100 μm (for embryos). |

tRNAs and 5′tRFls form sR-loops on tRNA loci in zebrafish embryos.
(A) Illustration of ssDNA and RNA isolation from R-loops. (B) Illustration of sR-loop and aR-loop. The template (t-) and coding (c-) strands of DNA are depicted with different color lines. (C and D) Levels of R-loops in all protein-coding genes (C) and tRNA loci (D). Data are shown as means ± SD of two replicates. (E) The number of tRNA genes with altered sR-loop signals between two indicated stages. (F) The relative sR-loop signal changes on all tRNAGly/GCC and tRNAGlu/CTC loci during development. Data are shown as means ± SD. Wilcoxon matched-pairs signed-rank test was used with significance levels: ns, nonsignificant; ****P < 0.0001. (G) Detection of DNA-bound tRNAs and 5′tRFls by PCR using RNA template isolated from RNA:DNA hybrids in embryos at indicated stages. PCR was run for 25 to 34 cycles. See also fig. S4 for primers and specificity. (H) Quantification of DNA-bound specific tRNAs and 5′tRFls by RT-qPCR using RNA template isolated from RNA:DNA hybrids in embryos. qPCR results of RNA were normalized to Chr1-1 amplification signal of input genome, and signals of all samples were normalized to that at the shield stage. Ctr, control sample for which antibody (Ab) was replaced by IgG. (I) 5′tRFlGlu/CTC binds to tRNA genes during in vitro transcription. Left: Procedure for pulling down biotin-5′tRFlGlu/CTC–bound reporter DNA (see also Fig. 5D) with primer positions indicated. Right: qPCR result from three independent experiments (means ± SD). Biotin-GFP-r1 served as a negative control. Significant levels (Student’s t test, two-tailed) (H and I): *P < 0.05; **P < 0.01; ***P < 0.001; ****P < 0.0001. |

Effect of 5′tRFl knockdown on the formation of RNA:DNA hybrids on tRNA loci in zebrafish embryos.
(A) Experimental procedures. MO and cMO doses: 10 ng per embryo. (B) Increased RNA-bound DNA template strand levels on tRNAGlu/CTC genes in 5′tRFlGlu/CTC morphants. ssDNAs isolated from RNA:DNA hybrids in shield stage embryos were used as templates to amplify indicated tRNAGlu/CTC loci. (C and E) Decrease in tRNA and 5′tRFl levels in morphants. Total RNA extracted by neutral phenol:chloroform was used as template for RT-qPCR. (D and F) Increase in DNA-bound tRNA levels accompanied with decrease in DNA-bound 5′tRFls in morphants. RNA isolated from RNA:DNA hybrids was used as template for RT-qPCR. In (B), amplification signal of each tRNA locus was normalized to that in 5% genomic DNA input. In (C) to (F), all qRT-PCR signals were normalized to the level of Chr1-1 tRNAGlu/CTC locus from DNA input. Data are shown as means ± SD. Student’s t test (two-tailed). ns, not significant; *P < 0.05; **P < 0.01; ***P < 0.001. Stages of analyzed embryos: Shield stage in (C) and (D) and sphere stage in (E) and (F). |

tRNA gene transcription is regulated by tRNAs and 5′tRFls.
(A to C) RNASEH1 overexpression elevates endogenous tRNA levels. Wild-type (WT) (A and C) or Tg(Chr.21-1:tRNAGlu/CTC-F30-Broccoli) (B) embryos were injected with 300 pg of NLS-hRNASEH1-GFP [composition shown on top of (A)] or GFP mRNA at the 1c stage and immunostained for GFP observation at indicated stages (A) or at the 256c stage for examining expression levels of F30-Broccoli (B) or several tRNAs by RT-qPCR (C), which were normalized to 18S rRNA levels. Note that NLS-hRNASEH1-GFP was enriched in nuclei at 4 hpf. (D to F) Length-dependent regulation of tRNA gene transcription. Three tRNAGlu/CTC oligos with different lengths (D) were synthesized, and they have different minimum free energy (ΔG37°C) and melting temperature (Tm) for DNA:RNA hybrids (E). 1c stage Tg(Chr.21-1:tRNAGlu/CTC-F30-Broccoli) transgenic embryos were injected with individual RNA oligos at 60 fmol per embryo and harvested at the 256c stage for examining F30-Broccoli expression level by RT-qPCR analysis (F). The reporter expression level was normalized to 18S rRNA level. For data in (B), (C), and (F), the average with ±SD from three independent experiments is given. ns, nonsignificant with P > 0.05; *P < 0.05; **P < 0.01; ***P < 0.001 (Student’s t test, two-tailed). (G) Working model. Left: Scenario of tRNA gene (tDNA) transcription in wild-type zebrafish embryos. The major wave of zygotic gene activation for protein-coding genes occurs at the 1kc stage. Before the sphere stage, tDNA transcription may be slow because of tRNA association with the template strand. After the sphere stage, increasing amount of 5′tRFls, possibly with the aid of other factors, takes over the tRNA for binding with the template strand. Right: Scenario of tDNA transcription in embryos depleted of 5′tRFl in which full-length tRNA forms stable tRNA:DNA hybrids on the template strand and thus hinders tDNA transcription. DAPI, 4′,6-diamidino-2-phenylindole. |