
|
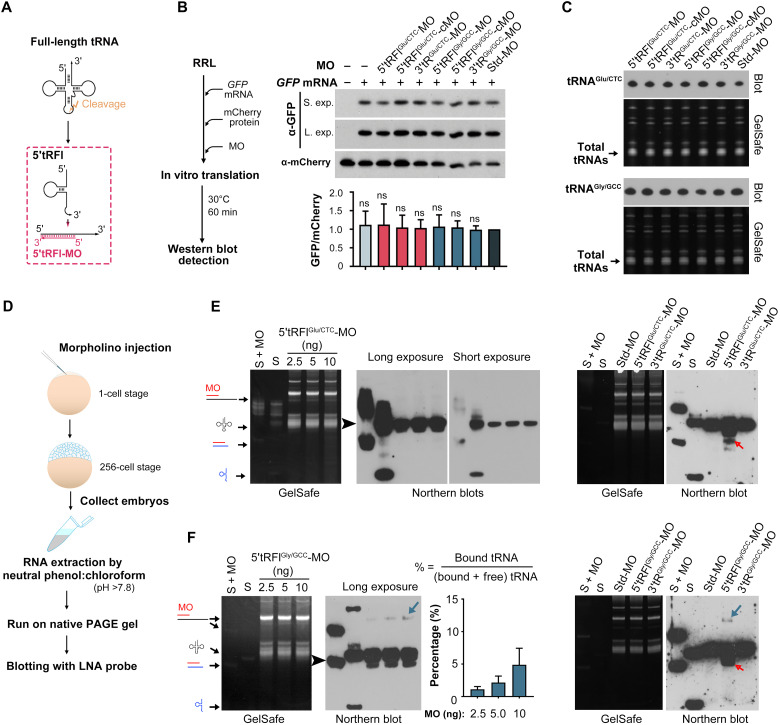
Fig. 2
(A) Illustration of 5′tRFl-MO target region. (B) 5′tRFlGly/GCC and 5′tRFlGlu/CTC MOs did not affect translation activity in the RRL in vitro translation system. Left: The experimental procedure. The synthesized and exogenous proteins were immunoblotted with anti-GFP and anti-mCherry antibody, respectively. Right top: Western blot results with short exposure (S. exp) or long exposure (L. exp). Bottom: The relative GFP/mCherry ratio quantified from band intensity. Data are shown in averages with ±SD from three independent experiments. ns, nonsignificant with P > 0.05 (Student’s t test, two-tailed). (C) Northern blot results of tRNAGlu/CTC (top) and tRNAGly/GCC (bottom) from the RRL system with the addition of different MOs using antisense LNA probes. (D) Experimental procedure for detection of the tRNA/MO complex by Northern blotting. (E and F) Estimation of MO binding capacity in vivo with tRNAGlu/CTC (E) or tRNAGly/GCC (F). Each blot was subjected to short or/and long exposure after hybridization. S, 1.2 ng of in vitro synthesized full-length tRNA and 1.2 ng of 5′tRFl-mimetic that were directly loaded onto gel; S + MO, preannealed synthetic tRNA (1.2 ng)/5′tRFl (1.2 ng) and MO (1.5 ng); other lanes in right, MO injection at 10 ng per embryo. The possible composition of each band after GelSafe staining is indicated by arrows. Note that 5′tRFlGlu/CTC-MO/tRNAGlu/CTC was undetectable, suggesting that they do not bind to each other. Weak 5′tRFlGly/GCC-MO/tRNAGly/GCC complex (indicated by a blue arrow) was detected and is quantified in the bar graph on the left. 5′tRFlGly/GCC/5′tRFlGly/GCC-MO or 5′tRFlGlu/CTC/5′tRFlGlu/CTC-MO complex is indicated by a red arrow.