
|
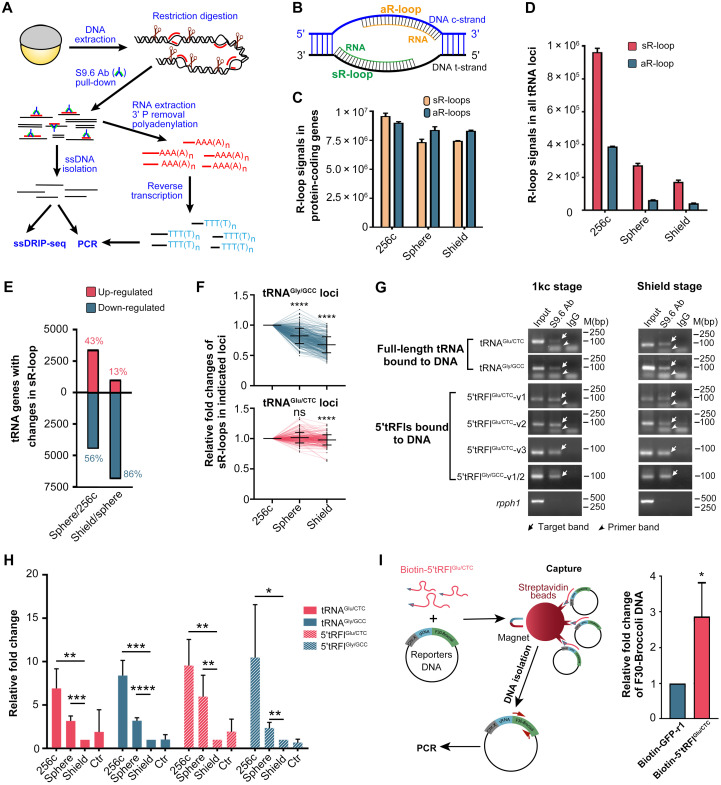
Fig. 7
(A) Illustration of ssDNA and RNA isolation from R-loops. (B) Illustration of sR-loop and aR-loop. The template (t-) and coding (c-) strands of DNA are depicted with different color lines. (C and D) Levels of R-loops in all protein-coding genes (C) and tRNA loci (D). Data are shown as means ± SD of two replicates. (E) The number of tRNA genes with altered sR-loop signals between two indicated stages. (F) The relative sR-loop signal changes on all tRNAGly/GCC and tRNAGlu/CTC loci during development. Data are shown as means ± SD. Wilcoxon matched-pairs signed-rank test was used with significance levels: ns, nonsignificant; ****P < 0.0001. (G) Detection of DNA-bound tRNAs and 5′tRFls by PCR using RNA template isolated from RNA:DNA hybrids in embryos at indicated stages. PCR was run for 25 to 34 cycles. See also fig. S4 for primers and specificity. (H) Quantification of DNA-bound specific tRNAs and 5′tRFls by RT-qPCR using RNA template isolated from RNA:DNA hybrids in embryos. qPCR results of RNA were normalized to Chr1-1 amplification signal of input genome, and signals of all samples were normalized to that at the shield stage. Ctr, control sample for which antibody (Ab) was replaced by IgG. (I) 5′tRFlGlu/CTC binds to tRNA genes during in vitro transcription. Left: Procedure for pulling down biotin-5′tRFlGlu/CTC–bound reporter DNA (see also Fig. 5D) with primer positions indicated. Right: qPCR result from three independent experiments (means ± SD). Biotin-GFP-r1 served as a negative control. Significant levels (Student’s t test, two-tailed) (H and I): *P < 0.05; **P < 0.01; ***P < 0.001; ****P < 0.0001.