
- Title
-
Combined blue light and daily thermocycles enhance zebrafish growth and development
- Authors
- de Alba, G., Carrillo, S., Sánchez-Vázquez, F.J., López-Olmeda, J.F.
- Source
- Full text @ J Exp Zool A Ecol Integr Physiol
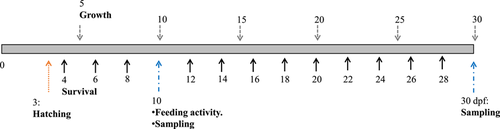
Schematic representation of the experimental design indicating the variables analyzed from Day 0 to 30 post fertilization (dpf). The orange dotted arrow indicates the hatching rate measurement at 3 dpf. The continuous black arrows denote the mortality measurement, taken every 2 days from 4 dpf. The grey continuous arrows represent the growth measurement, taken every 5 days from 5 dpf. The blue dotted arrows indicate the sampling points for analyzing gene expression. In addition at 10 dpf, food intake was measured |
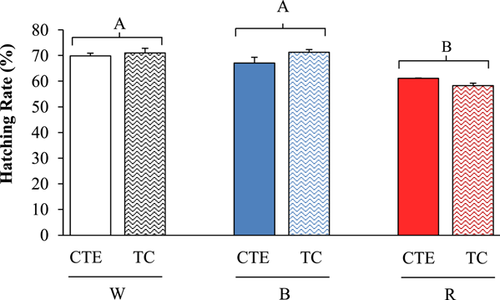
The hatching rates (%) of the zebrafish exposed to the combination of three different light wavelengths (white, W; blue, B; red, R) and two temperature regimes (a thermocycle of 28:24°C thermophase:cryophase, TC; and a constant temperature of 26.1 ± 0.1°C, CTE). Data (n = 6) are expressed as mean ± SEM of the percentage of hatched eggs, calculated at 3 days post fertilization (dpf). Different upper case letters indicate significant differences between light treatments (two-way ANOVA, p < 0.05). ANOVA, analysis of variance |
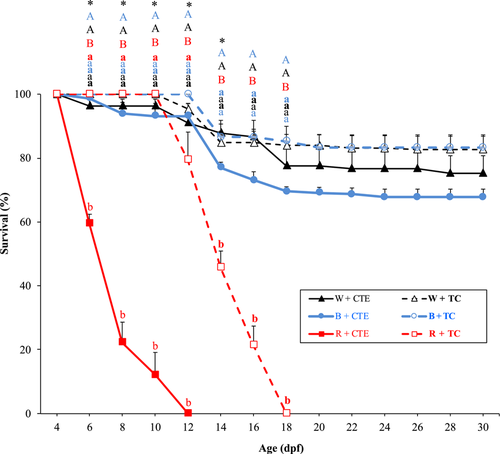
Effect of three different light wavelengths (white, W; blue, B; and red, R) and two temperature regimes (a thermocycle of 28:24°C thermophase:cryophase, TC; and constant temperature of 26.1 ± 0.1°C, CTE) on zebrafish larval survival from 4 to 30 days post-fertilization (dpf). Triangles, circles, and squares indicate the groups in the W, B, and R light spectra, respectively. Dashed and continuous lines denote the groups kept at the TC and CTE temperatures, respectively. Different lower case letters indicate significant differences between the experimental groups within the same dpf (one-way ANOVA, p < 0.05). Different upper case letters and asterisks indicate significant differences between light treatments and rearing temperature regimes, respectively, at the same dpf (two-way ANOVA, p < 0.05). Data (n = 4) are represented as mean ± SEM. ANOVA, analysis of variance |
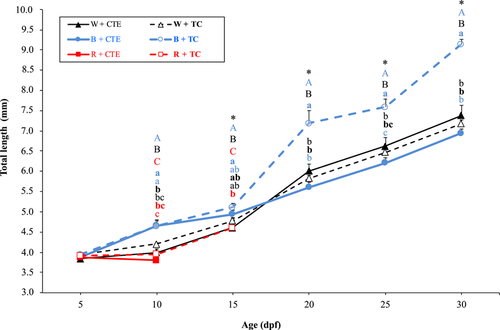
Effect of three different light wavelengths (white, W; blue, B; and red, R) and two temperature regimes (a thermocycle of 28:24°C thermophase:cryophase, TC; and constant temperature of 26.1 ± 0.1°C, CTE) on the total length (mm) of zebrafish larvae from 5 to 30 days post-fertilization (dpf). Triangles, circles, and squares indicate the groups in the W, B, and R light spectra, respectively. Dashed and continuous lines denote the groups kept at the TC and CTE temperatures, respectively. Different lower case letters represent significant differences between the experimental groups on the same dpf (one-way ANOVA, p < 0.05). Different upper case letters and asterisks indicate significant differences between the light treatments and rearing temperature regimes, respectively, on the same dpf (two-way ANOVA, p < 0.05). Data (n = 10) are represented as mean ± SEM. ANOVA, analysis of variance |
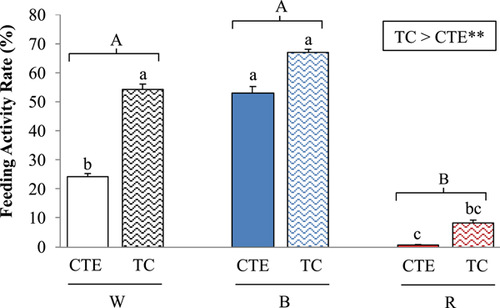
Effect of three different light wavelengths (white, W; blue, B; red, R) and two temperature regimes (a thermocycle of 28:24°C thermophase:cryophase, TC; and constant temperature of 26.1 ± 0.1°C, CTE) on the food intake (gut content) in the zebrafish larvae at 10 days post-fertilization (dpf). Different lower case letters indicate significant differences between the experimental groups on the same dpf (one-way ANOVA, p < 0.05). Different upper case letters and asterisks denote significant differences between the light treatments and rearing temperature regimes, respectively, on the same dpf (two-way ANOVA, p < 0.05). Data (n = 10) are represented as mean ± SEM. ANOVA, analysis of variance |
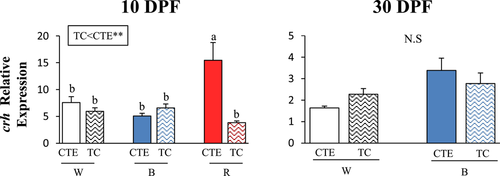
Relative mRNA expression of crh of the 10 (left panel) and 30 (right panel) days post fertilization (dpf) zebrafish larvae reared in three different light wavelengths (white, W; blue, B; red, R) and in two temperature regimes (a thermocycle of 28:24°C thermophase:cryophase, TC; and constant temperature of 26.1 ± 0.1°C, CTE). Different lower case letters indicate significant differences between the experimental groups on the same dpf (one-way ANOVA, p < 0.05). Different upper case letters and asterisks denote significant differences between the light treatments and rearing temperature regimes, respectively, on the same dpf (two-way ANOVA, p < 0.05). Data (n = 6) are represented as mean ± SEM. ANOVA, analysis of variance; mRNA, messenger RNA |
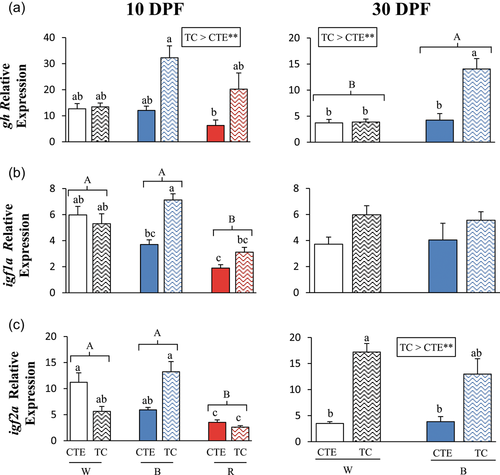
Relative mRNA expression of gh (a), igf1a (b), and igf2a (c) of the 10 (left panels) and 30 (right panels) days post fertilization (dpf) zebrafish larvae reared in three different light wavelengths (white, W; blue, B; red, R) and in two temperature regimes (a thermocycle of 28:24°C thermophase:cryophase, TC; and constant temperature of 26.1 ± 0.1°C, CTE). Different lower case letters indicate significant differences between the experimental groups on the same dpf (one-way ANOVA, p < 0.05). Different upper case letters and asterisks denote significant differences between the light treatments and rearing temperature regimes, respectively, on the same dpf (two-way ANOVA, p < 0.05). Data (n = 6) are represented as mean ± SEM. ANOVA, analysis of variance; mRNA, messenger RNA |
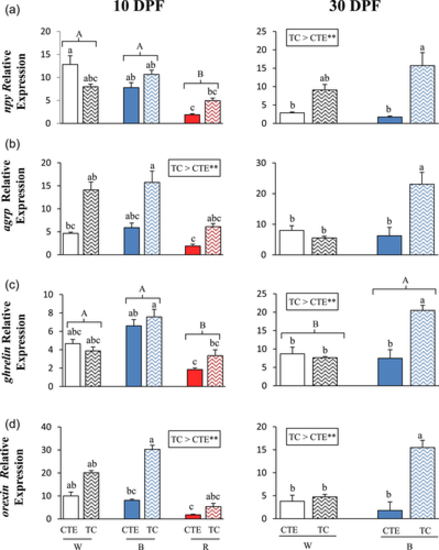
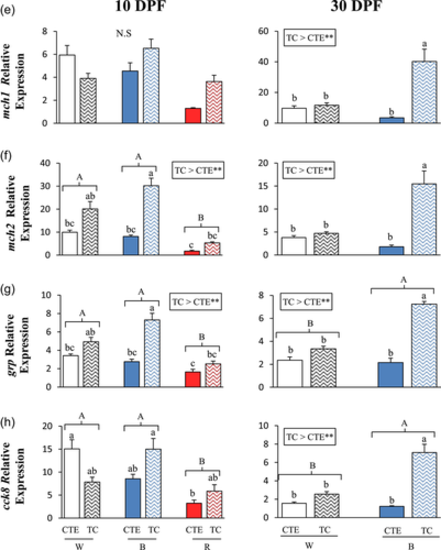
Relative mRNA expression of npy (a), agrp (b), ghrelin (c), orexin (d), mch1 (e), mch2 (f), grp (g), and cck8 (h) of the 10 (left panels) and 30 (right panels) days post fertilization (dpf) zebrafish larvae reared in three different light wavelengths (white, W; blue, B; red, R) and in two temperature regimes (a thermocycle of 28:24°C thermophase:cryophase, TC; and constant temperature of 26.1 ± 0.1°C, CTE). Different lower case letters indicate significant differences between the experimental groups on the same dpf (one-way ANOVA, p < 0.05). Different upper case letters and asterisks denote significant differences between the light treatments and rearing temperature regimes, respectively, on the same dpf (two-way ANOVA, p < 0.05). Data (n = 6) are represented as mean ± SEM. ANOVA, analysis of variance; mRNA, messenger RNA |
Relative mRNA expression of npy (a), agrp (b), ghrelin (c), orexin (d), mch1 (e), mch2 (f), grp (g), and cck8 (h) of the 10 (left panels) and 30 (right panels) days post fertilization (dpf) zebrafish larvae reared in three different light wavelengths (white, W; blue, B; red, R) and in two temperature regimes (a thermocycle of 28:24°C thermophase:cryophase, TC; and constant temperature of 26.1 ± 0.1°C, CTE). Different lower case letters indicate significant differences between the experimental groups on the same dpf (one-way ANOVA, p < 0.05). Different upper case letters and asterisks denote significant differences between the light treatments and rearing temperature regimes, respectively, on the same dpf (two-way ANOVA, p < 0.05). Data (n = 6) are represented as mean ± SEM. ANOVA, analysis of variance; mRNA, messenger RNA |