
|
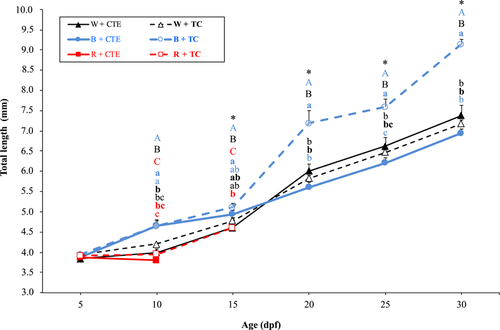
Fig. 4 Effect of three different light wavelengths (white, W; blue, B; and red, R) and two temperature regimes (a thermocycle of 28:24°C thermophase:cryophase, TC; and constant temperature of 26.1 ± 0.1°C, CTE) on the total length (mm) of zebrafish larvae from 5 to 30 days post-fertilization (dpf). Triangles, circles, and squares indicate the groups in the W, B, and R light spectra, respectively. Dashed and continuous lines denote the groups kept at the TC and CTE temperatures, respectively. Different lower case letters represent significant differences between the experimental groups on the same dpf (one-way ANOVA, p < 0.05). Different upper case letters and asterisks indicate significant differences between the light treatments and rearing temperature regimes, respectively, on the same dpf (two-way ANOVA, p < 0.05). Data (n = 10) are represented as mean ± SEM. ANOVA, analysis of variance