
|
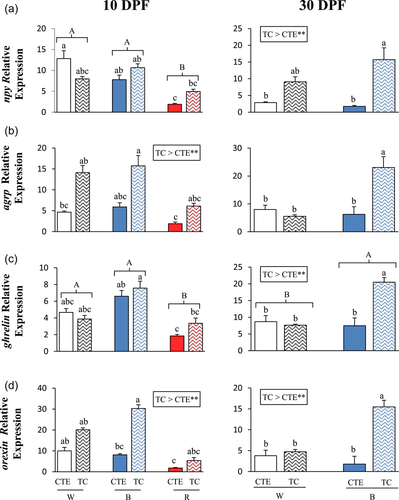
Fig. 8 Relative mRNA expression of npy (a), agrp (b), ghrelin (c), orexin (d), mch1 (e), mch2 (f), grp (g), and cck8 (h) of the 10 (left panels) and 30 (right panels) days post fertilization (dpf) zebrafish larvae reared in three different light wavelengths (white, W; blue, B; red, R) and in two temperature regimes (a thermocycle of 28:24°C thermophase:cryophase, TC; and constant temperature of 26.1 ± 0.1°C, CTE). Different lower case letters indicate significant differences between the experimental groups on the same dpf (one-way ANOVA, p < 0.05). Different upper case letters and asterisks denote significant differences between the light treatments and rearing temperature regimes, respectively, on the same dpf (two-way ANOVA, p < 0.05). Data (n = 6) are represented as mean ± SEM. ANOVA, analysis of variance; mRNA, messenger RNA