- Title
-
Natterin-like depletion by CRISPR/Cas9 impairs zebrafish (Danio rerio) embryonic development
- Authors
- Seni-Silva, A.C., Maleski, A.L.A., Souza, M.M., Falcao, M.A.P., Disner, G.R., Lopes-Ferreira, M., Lima, C.
- Source
- Full text @ BMC Genomics
|
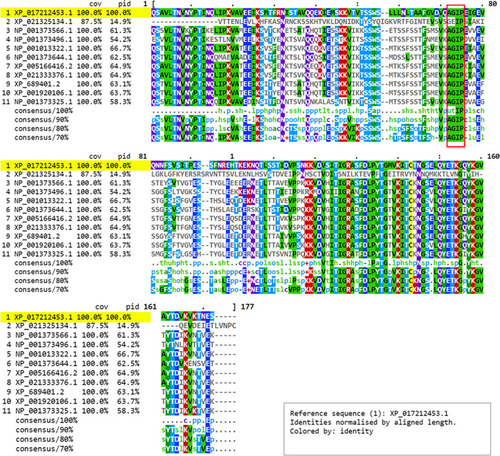
Multiple sequence alignment of the zebrafish natterin-like proteins evidencing the identity among residues within the aerolysin domain. The zebrafish natterin-like protein sequences were obtained from National Center for Biotechnology Information (NCBI) and aligned through Clustal Omega (European Molecular Biology Laboratory - EMBL/European Bioinformatics Institute - EBI). The alignment is displayed in MView evidencing the coverage (cov), percentage of identity (pid), and consensus among proteins. The highlight in yellow→indicates the reference natterin protein studied herein coded by |
|
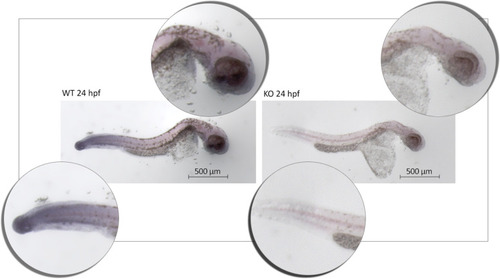
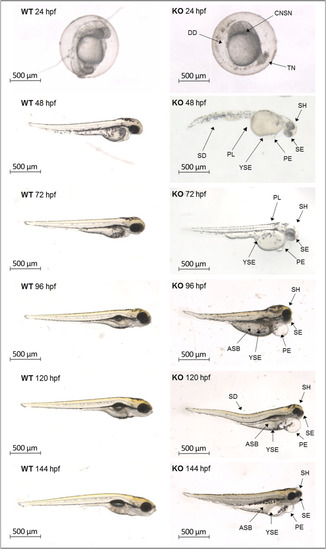
Qualitative evaluation of |
|
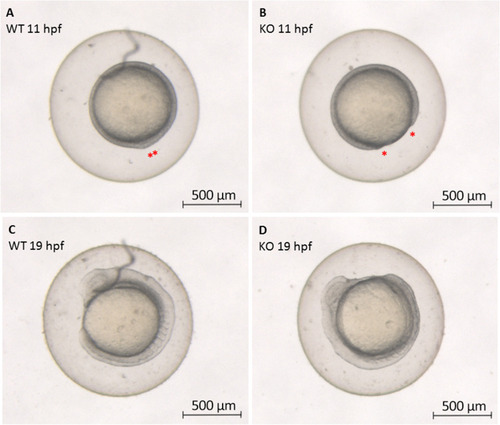
Zebrafish epiboly progression. The differences in epiboly progression are evidenced in wild-type (WT) (left) and CRISPR/Cas9 |
|
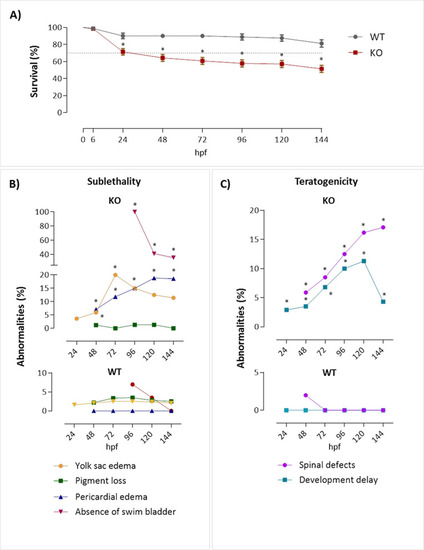
Survival rate, sublethal and teratogenic abnormalities of zebrafish after depletion of the |
|
Analysis of aberrant phenotypes in |
|
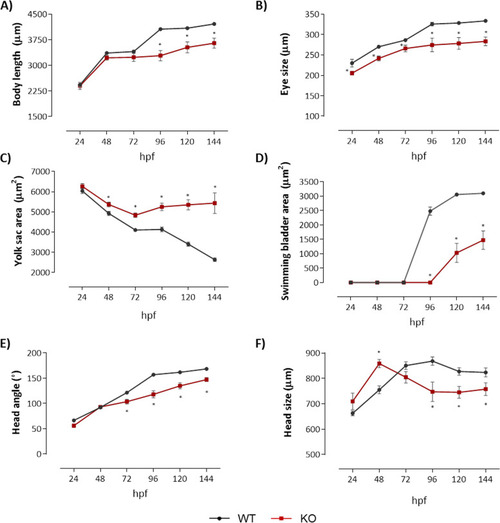
Depletion of natterin-like protein ( |
|
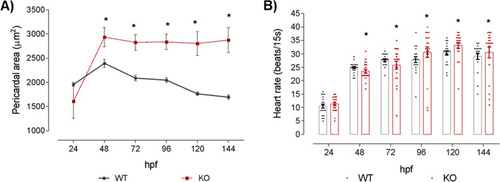
Cardiac alterations of natterin-like depleted (KO) zebrafish larvae. The KO or the wild-type (WT) larvae had the heart area and heartbeat rate measured at 24, 48, 72, 96, 120, and 144 h post-fertilization (hpf; 20 larvae per time). Pericardial measurement was evaluated using the ImageJ software from images obtained in a Leica M205C stereomicroscope. The data represent the average of each measurement at the designated time (A; 20 larvae per group). The beat rate was counted in 15 s videos acquired on the Leica M205C stereomicroscope at 50x magnification (LAS V4.11 software). Dot plot data show heart rate individually and the bars represent the mean of each group plus the standard deviation (B). The asterisks (*) represent a significant difference with the WT control (p < 0.05) |
|
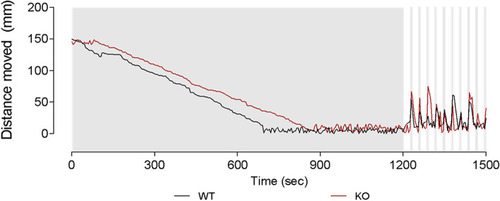
Locomotor analysis of natterin-like depleted (KO) zebrafish larvae. The 144 h post-fertilization (hpf) KO or wild-type (WT) larvae were distributed in a 96-well plate (1 larva/well; 20 larvae per group) in 100 μL of medium and the locomotor activity represented by the distance moved was analyzed through the Zebrabox system (ViewPoint). Larvae were exposed to an acclimatization period of 20 min in the dark followed by 5 min of alternated 25 s light cycles (15% light stimulus) interspersed with 5 s dark cycles (0% light stimulus) to induce visual and neurological stimulation |

