
- Title
-
Fgf8 dynamics and critical slowing down may account for the temperature independence of somitogenesis
- Authors
- Zhang, W., Scerbo, P., Delagrange, M., Candat, V., Mayr, V., Vriz, S., Distel, M., Ducos, B., Bensimon, D.
- Source
- Full text @ Commun Biol
|
|
|

|
Negative |
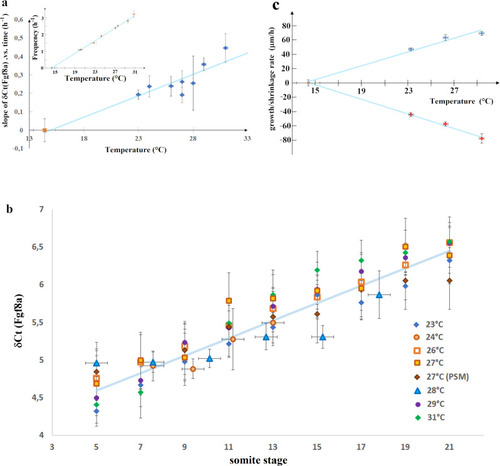
Variation with temperature of the dynamics of fgf8 mRNA, tail growth and PSM shrinkage.
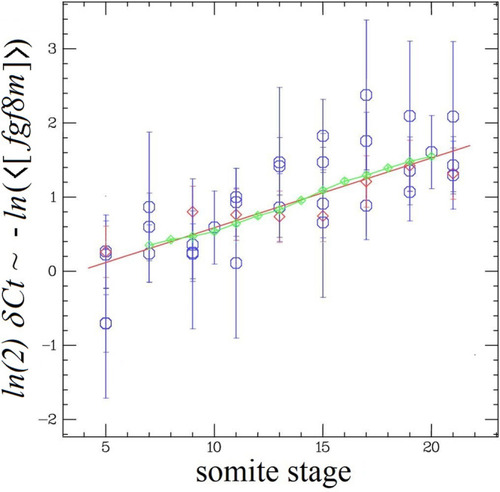
a Variation with temperature of the slope α of δCt(fgf8(t)) vs time (Fig. 5), which is linearly related to the exponential decay rate of <[fgf8m]>: 1/τ = ln(2) α. The red point at 27 °C is from PSM only data. The data can be fit (blue line) by α = a (T−Tc) with: a = 0.022 ± 0.0038; Tc = 14.4 °C (Χ2 = 6.57; DF = 6). Inset: variation of the clock frequency fs = 1/τs vs temperature2 (data from Schröter et al.2) which can be fit by fs = as (T − Tc) with as = 0.188. b Another way to represent the data shown in a: since δCt(fgf8 (t)) varies with temperature in a similar way as the segmentation period, τs, the δCt(fgf8(t)) data taken at different temperatures collapse on the same curve as a function of somite stage: s = t/τs (=number of segmentation periods). The data at all temperatures can be fit (blue line) by δCt = a′ s + b, with a′ = 0.122 ± 0.0098 and b = 3.955 (χ2 = 26.5; DF = 55). Notice that as expected: a = a′∙ as. c variation with temperature of the growth rate (blue points) and the PSM shrinkage rate (red points) and linear best fits (blue lines): y = β(T − Tc) with β = 4.79 ± 0.46 (χ2 = 6.35; DF = 2; blue points) and β = −5.08 ± 0.20 (χ2 = 0.51; DF = 2; red points). |
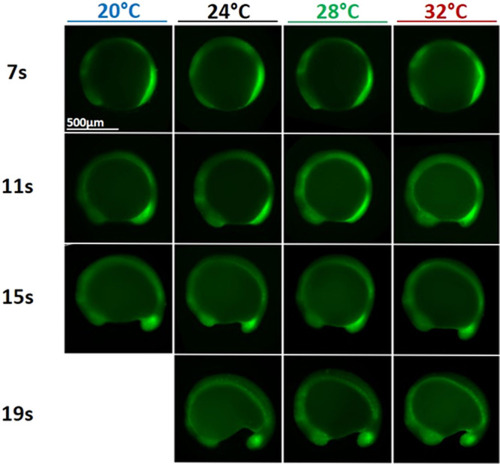
Phosphorylated Erk (pErk) distribution in WT embryos grown at different temperatures (20, 24, 28, and 32 °C) at 4 different stages of somitogenesis (7, 11, 15, or 19 somites stages) visualized by fluorescence following Immunohistochemistry staining (IHC). Even though embryos at 20 °C grow about three time slower than embryos at 32 °C, at similar stages embryos grown at different temperatures are similar and display similar pErk domain. |
The |