FIGURE

Fig. 8

ID
ZDB-FIG-220219-17
Publication
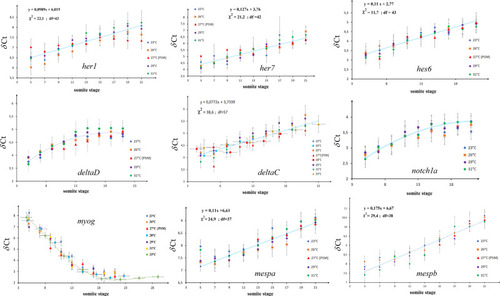
Zhang et al., 2022 - Fgf8 dynamics and critical slowing down may account for the temperature independence of somitogenesis
Other Figures
All Figure Page
Back to All Figure Page
Fig. 8

Variation with temperature of various gene transcripts.

The δCt of genes (her1, her7, hes6, deltaC, deltaD, notch1a, myog, mespa, and mespb) known to play a role in somitogenesis relative to reference genes (rpl13a or β-actin) are plotted as a function of somite stage. Notice that as a function of somite stage the data taken at different temperatures collapse on the same curve. For some genes for which δCt appears to vary linearly with somite stage (exponentially decreasing concentrations) we display the best fit. For others the continuous curve is just a guide to the eye. The increasing concentration of myog (decreasing δCt values) is consistent with its role as a differentiation factor during myogenesis which follows somite formation.

Expression Data

Expression Detail
Antibody Labeling
Phenotype Data

Phenotype Detail
Acknowledgments
This image is the copyrighted work of the attributed author or publisher, and ZFIN has permission only to display this image to its users. Additional permissions should be obtained from the applicable author or publisher of the image. Full text @ Commun Biol