
- Title
-
Conservation of Differential Animal MicroRNA Processing by Drosha and Dicer
- Authors
- Zhang, X., Yang, F., Liu, F., Tian, Q., Hu, M., Li, P., Zeng, Y.
- Source
- Full text @ Front Mol Biosci
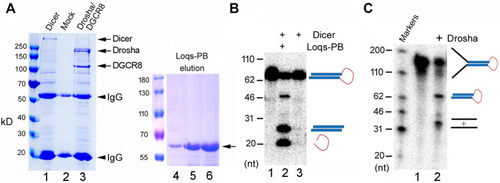
Purification and activity assays of the fruitfly miRNA processing enzymes. (A) Purification of recombinant Dicer, Drosha/DGCR8 from transfected 293T cells (lanes 1–3) and Loqs-PB from overexpressing bacteria (lanes 4–6). 293T cells were transfectd with plasmids expressing the FLAG-tagged Dicer or FLAG-tagged Drosha and Myc-tagged DGCR8. Following immunoprecipitation with an anti-FLAG antibody, proteins were detected by gel electrophoresis and Coomassie staining. Lane 1: The immunoprecipitate of FLAG-Dicer; lane 2: immunoprecipitate from mock-transfected cells; lane 3: immunoprecipitate of FLAG-Drosha and Myc-DGCR8; lanes 4–6: different elution fractions of His-tagged Loqs-PB after nickle beads purification. Arrows points to the expected fruitfly proteins, and arrowheads the IgG heavy and light chains. Protein markers (in kilodaltons, kD) are indicated on the left. (B) Dicer activity assay. The 32P-labeled dme-pre-miR-375 was incubated with Dicer alone or together with Loqs-PB at 37°C for 30 min, fractionated on a 12% denaturing gel, and analyzed by phosphorimaging. DNA markers with size of the individual bands in nucleotide (nt) are indicated on the left, and schematics of the substrate and cleavage products shown on the right. (C) Drosha processing assay. The 32P-labeled dme-pri-let-7 substrate was incubated with Drosha/DCGR8 (Drosha in short) at 37°C for 60 min. Samples were fractionated on a 10% denaturing gel and analyzed by phosphorimaging. Labels are the same as in (B). |

Time-course processing reactions by zebrafish and fruitfly Dicer and Drosha. (A) Cleavage of dre-pre-miRNAs by zebrafish Dicer. Arrows point to cleavage products. Timepoints are indicated on top of the gel image, DNA markers (in nt) shown on the left. (B) Cleavage of dme-pre-miRNAs by fruitfly Dicer. (C) Cleavage of dre-pri-miRNAs by zebrafish Drosha. (D) Cleavage of dme-pri-miRNAs by fruitfly Drosha. (E) Quantification of the data in (A–D). The y-axes are the raw substrate cleavage ratios, with averages and standard deviations, plotted against the different time points in the x-axes. |

Representative processing reactions by zebrafish and fruitfly Dicer and Drosha. (A) Cleavage of 32P-labeled dre-pre-miRNAs by zebrafish Dicer. miRNA substrates are indicated on top of the gel image, DNA markers shown on the left, and the arrowhead points to the cleavage product(s). (B) Cleavage of dme-pre-miRNAs by fruitfly Dicer. Labeling is the same as in (A). (C) Cleavage of dre-pri-miRNAs by zebrafish Drosha. Arrowheads point to cleavage products. (D) Cleavage of different dme-pri-miRNAs by fruitfly Drosha. Labeling is the same as in (C). |

Conserved miRNAs are more efficiently processed and better expressed. (A) Comparing the relative Drosha cleavage efficiencies (the left panel), Dicer cleavage efficiencies (the middle panel), and mature miRNA expression (the right panel) between the conserved and unique zebrafish miRNAs (x-axes). The right panel analyzed all the miRNAs, i.e., not just the Drosha or Dicer substrates examined in this study, and the y-axis is miRNA expression values after log10 transformation (GSE57169). Averages and standard deviations are shown, the P values listed on top, and parentheses indicate the numbers of miRNAs in the categories. (B) Comparing the relative Drosha cleavage efficiencies (the left panel), Dicer cleavage efficiencies (the middle panel), and mature miRNA expression (GSE163852; the right panel) between the conserved and unique fruitfly miRNAs (x-axes). Labels are the same as in (A). |

Pri-miRNA preferences by Drosha. (A) Schematics of an animal pri-miRNA. The important secondary structural features are shown, along with positions of the UG, UGU, mGHG, and CNNC motifs. (B) Predicted secondary structures of dme-pri-miRNAs and their mutants. Arrows point to Drosha cleavage sites predicted by miRBase. (C) Fruitfly Drosha processing of the dme-pri-miRNAs and their mutants. Positions of DNA markers are shown in the left. |

Contributions by UG, UGU, and CNNC motifs to Drosha processing and miRNA expression. (A) Comparison of relative Drosha cleavage efficiencies (y-axis) of fruitfly, zebrafish, and human pri-miRNAs with or without the UG, UGU, or CNNC motif (listed on top). Different colors represent different species (x-axis). Columns on the left represent miRNAs without the sequence motif, those on the right with the motif. Integers underneath the columns indicate numbers of miRNAs in the categories. Averages and standard deviations are shown, and the P values shown above the columns, with those <0.05 in red. (B) Normalized expression (y-axis) of fruitfly, zebrafish, and human miRNAs (x-axis) with or without the UG, UGU, or CNNC motif (on top). Labels are the same as in (A). (C) Comparison of relative Drosha cleavage efficiencies (y-axis) of fruitfly, zebrafish, and human pri-miRNAs with 0, 1, 2, or 3 of the UG, UGU, and/or CNNC motifs (x-axis). Labeling is the same as in (A). The various categories are indicated at the bottom, with numbers of the miRNAs listed in parentheses. (D) Normalized expression (y-axis) of fruitfly, zebrafish, and human miRNAs with 0, 1, 2, or 3 of the UG, UGU, and/or CNNC motifs (x-axis). Labels are the same as in (C). (E) Comparison of relative Dicer cleavage efficiencies (y-axis) of fruitfly, zebrafish, and human pre-miRNAs with or without the UGU motif. Different colors represent different species (x-axis). Columns on the left represent miRNAs without the sequence motif, those on the right with the motif. Integers underneath the columns indicate numbers of miRNAs in the categories. Averages and standard deviations are shown, and the P values indicated above the columns. |