
- Title
-
Characterization and tissue localization of zebrafish homologs of the human ABCB1 multidrug transporter
- Authors
- Robey, R.W., Robinson, A.N., Ali-Rahmani, F., Huff, L.M., Lusvarghi, S., Vahedi, S., Hotz, J.M., Warner, A.C., Butcher, D., Matta, J., Edmondson, E.F., Lee, T.D., Roth, J.S., Lee, O.W., Shen, M., Tanner, K., Hall, M.D., Ambudkar, S.V., Gottesman, M.M.
- Source
- Full text @ Sci. Rep.
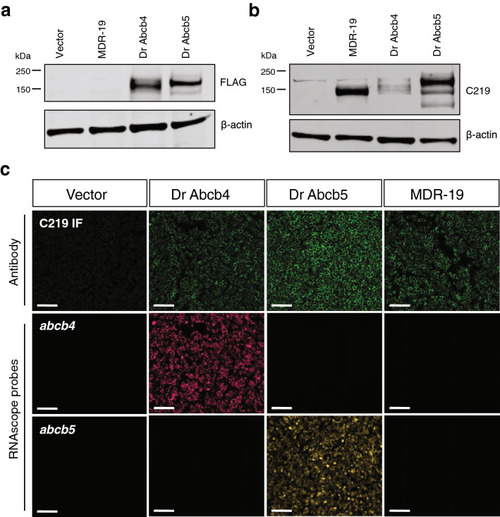
Characterization of cells transfected to express human ABCB1, zebrafish Abcb4 or Abcb5. Whole cell lysates were prepared from HEK293 cells transfected with empty vector (Vector), human ABCB1 (MDR-19), zebrafish abcb4 (Dr Abcb4) or abcb5 (Dr Abcb5), subjected to polyacrylamide gel electrophoresis and transferred to nitrocellulose. Blots were probed with anti-FLAG antibody and beta actin (a) or anti-ABCB1 antibody C219 and beta-actin (b). Sections in (a) were cropped from the blot in Supplementary Fig. S1a; sections in (b) were cropped from the blot in Supplemental Fig. S1b. (c) Paraffin-embedded cells (from a and b) were probed with the C219 antibody (top row, green staining) or RNAscope probes to detect zebrafish abcb4 (middle row, magenta staining) or zebrafish abcb5 (bottom row, yellow staining), as outlined in Materials and Methods. Bar = 100 µm. |

High-throughput screening demonstrates that substrate specificity of zebrafish Abcb4 closely resembles that of human P-gp. (a) High throughput screening was performed with 90 human P-gp substrates with empty vector transfected cells (Vector) or cells transfected to express zebrafish Abcb4 (Dr Abcb4), zebrafish Abcb5 (Dr Abcb5) or human P-gp (MDR-19). Compound activity was then subjected to unsupervised clustering against Vector, Dr Abcb4, Dr Abcb5 and MDR-19 cells. Darker red color represents greater cytotoxicity. (b) The difference in AUC (delta AUC) was determined as the difference between Vector cells as compared to Dr Abcb4, Dr Abcb5 or MDR-19 cells. The delta AUC values for human P-gp (MDR-19 cells) were compared to those of zebrafish Abcb4 (Dr Abcb4) or zebrafish Abcb5 (Dr Abcb5). Solid lines represent lines of best fit and dashed lines are 95% confidence intervals. (c) Three-day cytotoxicity assays were performed with 6 substrates included in the screen—17-AAG, AT9283, KW-2478, romidepsin, VX-680 and YM-155. Results from all the experiments are summarized in Table S2. |
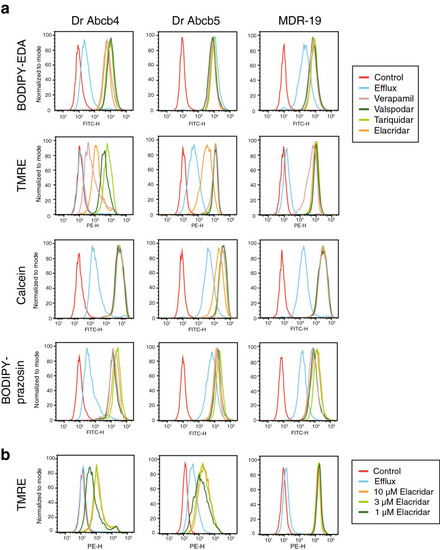
Zebrafish Abcb4 and Abcb5 differentially transport fluorescent P-gp substrates. (a) HEK293 cells transfected to express zebrafish Abcb4 (Dr Abcb4), zebrafish Abcb5 (Dr Abcb5) or human P-gp (MDR-19) were incubated in medium with 0.5 µM BODIPY FL-EDA, 0.5 µM TMRE, 150 nM calcein-AM or 0.5 µM BODIPY prazosin in the presence or absence of 10 µM elacridar, 10 µM tariquidar, 10 µM valspodar, or 100 µM verapamil for 30 min. The medium was removed and replaced with substrate-free medium in the presence or absence of inhibitor for an additional 1 h. Cells were incubated with fluorescent substrate alone, yielding the Efflux histogram and cell autofluorescence is depicted by the Control histogram. (b) Cells from (a) were incubated with medium containing 0.5 µM TMRE in the presence or absence of 1, 3, or 10 µM elacridar for 30 min after which the medium was removed and replaced with substrate-free medium in the presence or absence of inhibitor for an additional 1 h. |
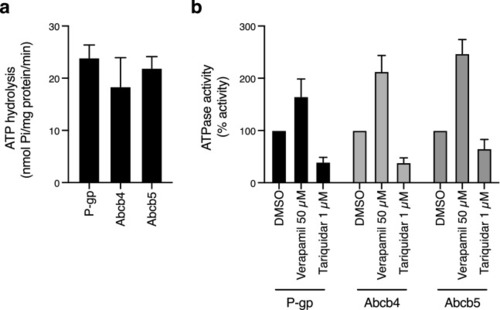
ATPase activity of zebrafish Abcb4 and Abcb5 is similar to that of human P-gp. (a) The vanadate-sensitive activity of zebrafish Abcb4, zebrafish Abcb5 and human P-gp was determined as outlined in Materials and Methods using membranes isolated from Dr Abcb4, Dr Abcb5 or MDR-19 cells, respectively. (b) Basal P-gp ATPase activity (DMSO) was compared to activity in the presence of 50 µM verapamil, or in the presence of 1 µM tariquidar. Graphs from (a) and (b) depict average values from three independent experiments (error bars ± SD). |
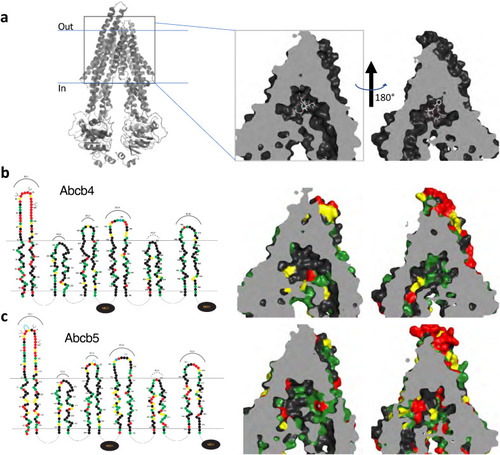
3D homology modeling of amino acid similarity in the binding pocket of zebrafish Abcb4 and Abcb5. (a) 3D modeling of the human P-gp structure that models P-gp in complex with taxol and the Fab of the UIC2 antibody (PDB:6QEX). The model is split into two halves to provide a clearer view. Amino acid differences in the transmembrane regions of the models of human P-gp and zebrafish Abcb4 (b) and Abcb5 (c) are shown. In (b) and (c), on the left side linear 2D models of Abcb4 and Abcb5 are shown. Amino acids (filled circles) similar to human P-gp are shown in green (most similar), yellow (fairly similar) or red (least similar). |

Immunohistochemical staining of Abcb4 and Abcb5 with the C219 antibody in adult zebrafish. Whole adult zebrafish were stained with the C219 antibody (a) or negative control (b), as noted in Materials and Methods. Bar = 5 mm for (a) and (b). Regions of interest are indicated (a) and expanded in subsequent panels (c–h). C219 staining of the zebrafish brain (c) with an enlarged portion of the cerebellum (d). Positive staining of C219 antibody was also noted in gill epithelium (e), a subset of renal tubules or collecting ducts (*) (f), hepatocytes (g), and the epidermis (h). Bar = 700 µm for (c) and 200 µm for (d–h). EXPRESSION / LABELING:
|

Zebrafish abcb4 RNA colocalizes with C219 staining in the zebrafish brain (telencephalon) and gastrointestinal tract of adult zebrafish. Zebrafish sections were stained with RNAscope abcb4 (yellow) and abcb5 (green) probes followed by the C219 antibody (red), as outlined in Materials and Methods. Fluorescence channels were interrogated individually and merged in sections of the zebrafish brain (left column) or gastrointestinal tract (right column). Bars = 50 µm. Nuclei were stained with DAPI (blue). Inset shows an enlarged portion of each image, denoted by the dashed box. EXPRESSION / LABELING:
|

Zebrafish abcb4 colocalizes with claudin-5 in the zebrafish brain (mesencephalon). Zebrafish sections were stained with H&E and RNAscope abcb4-C2 (green) followed by an antibody to claudin-5 (red), as outlined in Materials and Methods. Nuclei were stained with DAPI (blue). Fluorescence channels were interrogated individually and merged. Bar = 200 µm for H&E image and 100 µm for fluorescence images. EXPRESSION / LABELING:
|

ZFIN is incorporating published figure images and captions as part of an ongoing project. Figures from some publications have not yet been curated, or are not available for display because of copyright restrictions. EXPRESSION / LABELING:
|
|
ZFIN is incorporating published figure images and captions as part of an ongoing project. Figures from some publications have not yet been curated, or are not available for display because of copyright restrictions. EXPRESSION / LABELING:
|