FIGURE SUMMARY
Title

High-Resolution, 3D Imaging of the Zebrafish Gill-Associated Lymphoid Tissue (GIALT) Reveals a Novel Lymphoid Structure, the Amphibranchial Lymphoid Tissue

Authors
Dalum, A.S., Kraus, A., Khan, S., Davydova, E., Rigaudeau, D., Bjørgen, H., López-Porras, A., Griffiths, G., Wiegertjes, G.F., Koppang, E.O., Salinas, I., Boudinot, P., Rességuier, J.
Source
Full text @ Front Immunol

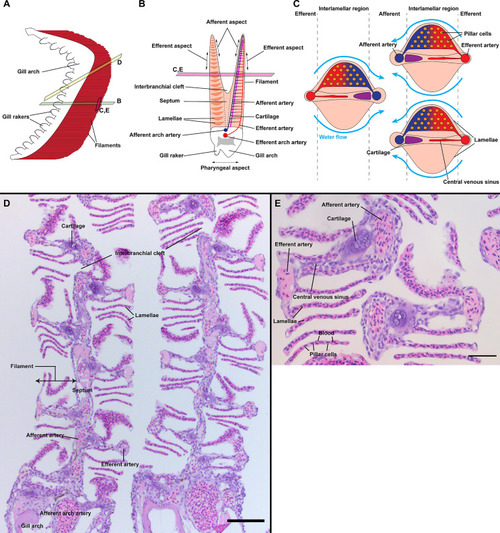
General organization of zebrafish gills. Schematic representations of the overall anatomy of adult zebrafish gills as observed from the side (A), through a transversal plane across the gill arch (B) and through a coronal plane across gill filaments (C). Section plane are illustrated in (A, B). The blood flows from the afferent artery to the lamellae where it gets oxygenated and leave by the efferent artery. Counter-current to the blood, the water irrigates the lamellae from the efferent aspect to the afferent aspect of filaments. (D) Paraffin section (2 µm) displaying two gill arches through an oblique coronal plane, as illustrated in (A). (E) Paraffin section (2 µm) displaying two filaments through a coronal plane, as illustrated in (A, B). Scale bars: 50 µm (D) and 20 µm (E).

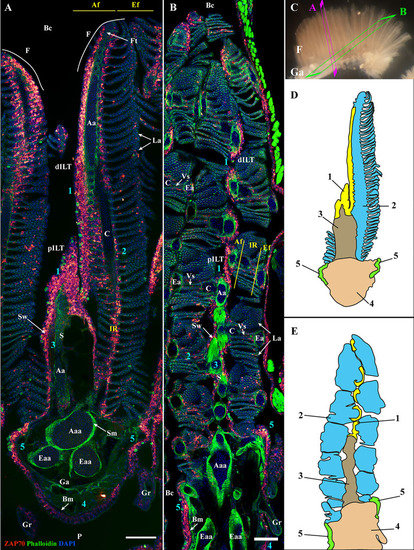
General organization of the zebrafish GIALT. Representative deconvolved confocal images of adult zebrafish gills acquired from a transversal (A) and oblique longitudinal orientations (B). The section planes are illustrated on a dissected gill arch in (C). Images were acquired from 30 μm whole-body cryosections stained with phalloidin (actin -green) and DAPI (DNA-blue) and where T/NK cells were labeled with anti-ZAP70 antibody (red hot). Both transversally and longitudinally sectioned gills display a distribution of ZAP70 positive cells that is connected to the different morphological territories of the gills, thus revealing the segmentation of the GIALT into five sub-regions (1-5) (ILT, interlamellar region-lamellae-efferent aspect of filaments, interbranchial septum, gill arch, T/NK cell clusters at the base of filaments on each side of the gill arch). (D, E) Schematic representation of (A, B) displaying the 5 sub-regions of the GIALT. (A, B) Images are maximum intensity projections (MIP). Annotations: Aa, Afferent artery; Aaa, Afferent arch artery; Af, Afferent aspect of filaments; Bc, Branchial cavity; Bm, Basement membrane; C, Cartilage; dILT, distal Interbranchial Lymphoid Tissue; Eaa, Efferent arch artery; Ea, Efferent artery; Ef, Efferent aspect of filaments; F, Filament; Ft, Filament top; Ga, Gill arch; Gr, Gill raker; IR, Interlamellar region; La, Lamellae; P, Pharynx; pILT, proximal Interbranchial Lymphoid Tissue; S, Septum; Sm, Smooth muscles; Sw, Septum wall and Vs, Venous sinus. Scale bars: 100 μm (A, B).

The four zebrafish gill arches display the same lymphoid organization. Representative deconvolved confocal images of an adult zebrafish branchial cavity showing the 4 gills arches with transversal orientation (A). The plane of section is illustrated by the scheme at the bottom left. The images were acquired from 30 μm whole-body cryosections stained with phalloidin (green) and DAPI (blue) and where T/NK cells were labeled with anti-ZAP70 antibody (red hot). Each gill arch (Ga1-Ga4) possesses a GIALT segmented in five sub-regions (1-5) (ILT, interlamellar region-lamellae-efferent aspect of filaments, interbranchial septum, gill arch, T/NK cell clusters at the base of filaments on each side of the gill arch). (B) Schematic representation of (A) displaying the 5 sub-regions of the GIALT. (A) The image is a maximum intensity projection of 15 µm. Annotations: Bc, Branchial cavity; Ga, Gill arch and S, Septum. Scale bar: 200 μm.

Organization of the zf-GIALT above the gill arch. (Sub-regions 1-3). Representative deconvolved confocal high-resolution images of adult zebrafish gills acquired with a transversal (A, B) or coronal orientations (C–F). The different section planes are illustrated on panels (C) and in (G). Images were acquired from 30 μm whole-body cryosections stained with phalloidin (green) and DAPI (blue) and where T/NK cells were labeled with anti-ZAP70 antibody (red hot). (A) An overview of the top of an interbranchial septum showing the location of the proximal ILT over the vascular bleb from two opposite filaments. The cyan star indicates T/NK cells adhering to the endothelium of the vascular bleb. (B) Transversal acquisition through the middle of a filament illustrating the heterogeneity of the distribution of ZAP70 positive cells within a filament. (C) Coronal section across the proximal ILT showing the continuity of the ILT across the branchial cleft. (D–F) High-resolution images acquired with coronal orientations at different levels through the filaments [see panel (G)] and illustrating the zf-GIALT associated to the interbranchial septum. The cyan arrows in (D) indicate the basement membrane separating the vascular compartment from the ILT, the magenta star highlights a ZAP70neg immune cells within the vascular bleb, yellow arrowheads in (E, F) point to scattered T/NK cells within the septum, and cyan arrowheads in (F) highlight T/NK cells within a vessel of the septum. Images are maximum intensity projections: 2 µm (D–F). Annotations: Aa, Afferent artery; Am, adductor muscles; Bc, Branchial cavity; C, Cartilage; dILT, distal Interbranchial Lymphoid Tissue; Ea, Efferent artery; F, Filament; La, Lamellae; pILT, proximal Interbranchial Lymphoid Tissue; S, Septum; Sw, Septum wall and Vb, Vascular bleb. Scale bars: 100 μm (C) 40 μm (B) 30 μm (A) and 20 μm (D–F).

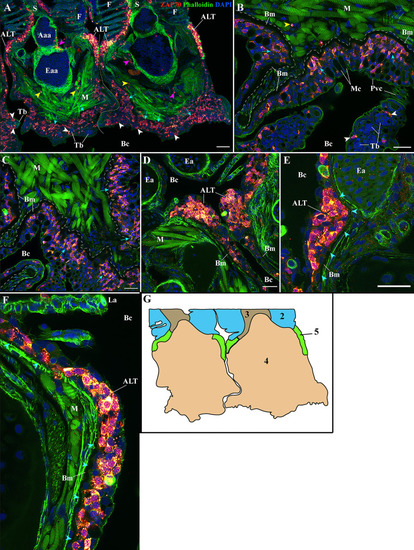
Organization of the zf-GIALT at the gill arch. (Sub-regions 4-5). Representative deconvolved confocal high-resolution images of adult zebrafish gills acquired with a transversal orientation. Images were acquired from 30 μm whole-body cryosections stained with phalloidin (green) and DAPI (blue) and where T/NK cells were labeled with anti-ZAP70 antibody (red hot). The localization of the GIALT sub-regions is illustrated in (G). (A) Lower magnification image illustrating the organization of the GIALT from two gill arches. Cyan arrows point to the numerous T/NK cells close to the basement membrane at the pharyngeal side of the gill arch. Yellow arrowheads highlight scattered T/NK cells within the gill arch, and white arrowheads localize taste buds. (B, C) Images at higher magnification of the zf-GIALT at the pharyngeal aspect of the gill arch. (D–F) Images at higher magnification of the T/NK cell clusters, forming the Amphibranchial Lymphoid Tissue (ALT), located on each side of the gill arches, at the base of filaments. The cyan arrowheads in (E, F) highlight the basement membrane and the reduction of its thickness at the level of the ALT. Images are maximum intensity projections: 2 µm (B–F). Annotations: Aaa, Afferent arch artery; ALT, Amphibranchial Lymphoid Tissue; Bc, Branchial cavity; Bm, Basement membrane; Eaa, Efferent arch artery; Ea, Efferent artery; F, Filament; La, Lamellae; M, Muscles; Mc, Mucous cell; Pvc, Pavement cell; S, Septum and Tb, Taste bud. Scale bars: 50 μm (A) and 20 μm (B–F).

The amphibranchial lymphoid tissue is a continuous structure along gill arches. Representative deconvolved confocal images of an adult zebrafish gill arch observed from the side. The images were acquired from wholemount dissected gill arches stained with phalloidin (green) and DAPI (blue) and where T/NK cells were labeled with anti-ZAP70 antibody (red hot). (A,A’) low magnification image of the gill arch illustrating the continuity of the ALT. (B–B’’) Images of the ALT at a higher magnification showing the contrast between the lymphoid organization of the ALT, the efferent aspect of filaments (green arrowheads), and the pharyngeal side of the gill arch (yellow arrowheads). Magenta arrowheads in (B’’) emphasize the enrichment of the ALT in rodlet cells, while the cyan arrowheads in (B, B’) point to the localization of neuromast-like ZAP70 negative structures. (C, D) Optical sections from within 3D acquisitions illustrating the variating thickness of the ALT. The white arrowheads point to the thinness of the ALT when at the level of the efferent artery compared to the thickness of the ALT when in-between filaments. (D) is deeper within the 3D acquisition than (C). (A–D) Images are maximum intensity projections: 5 μm (C, D), 25 μm (B–B’’) and 50 μm (A, A’). Annotations: ALT, Amphibranchial Lymphoid Tissue; Ea, Efferent artery; F, Filament; Ga, Gill arch; Gr, Gill raker and La, Lamellae. Scale bar: 20 μm (D), 40 μm (B, C) and 100 μm (A, A’).

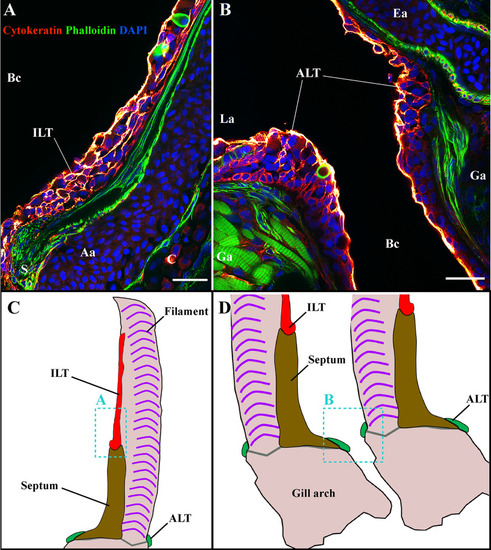
The ILT and ALT are structured by a complex network of reticulated epithelial cells. Representative deconvolved confocal images of adult zebrafish gills displaying the ILT (A) and the ALT (B) at high-magnification. The localization of sections (A, B) is illustrated on panels (C, D). The images were acquired from 30 μm whole-body cryosections stained with phalloidin (green) and DAPI (blue) and reticulated epithelial cells were labeled with an anti-cytokeratin antibody (red hot). While the cytokeratin signal is strong within the outermost layer of the epithelium, an intricate core of cytokeratin positive cells is observed within ILT (A) and ALT (B). Images are maximum intensity projections (2 µm). Annotations: Aa, Afferent artery; ALT, Amphibranchial Lymphoid Tissue; Bc, Branchial cavity; C, Cartilage; Ea, Efferent artery; Ga, Gill arch; ILT, Interbranchial Lymphoid Tissue; La, Lamella and S, Septum. Scale bars: 20 μm.

General organization of the structure lymphoid tissues in zebrafish gills. Schematic representations of the localization of the ALT (green) and ILT (yellow) within adult zebrafish gills. The ALT runs along the base of filaments while the ILT is found on the inner (afferent) aspect of filaments, on top of the interbranchial septum. (A) illustrates a gill arch as observed from the side. (B) represents a transversal plane through the gill arch, as illustrated on (A). (C) shows a gill arch as observed from above the filaments, as illustrated in (B). (D, E) Paraffin sections (2 µm) displaying the ALT, as illustrated in (B). (F, G) Paraffin section (2 µm) displaying the proximal ILT (pILT) and distal ILT (dILT), as illustrated in (B). Aa, Afferent artery; ALT, Amphibranchial Lymphoid Tissue; ILT, Interbranchial Lymphoid Tissue; dILT, distal Interbranchial Lymphoid Tissue and pILT, proximal Interbranchial Lymphoid Tissue. Scale bars: 20 µm (D–G).

Antigen-presenting cells and granulocytes are also present within the ILT and ALT. Representative deconvolved confocal images of adult zebrafish gills displaying the ILT (A, C, E, G) and the ALT (B, D, F, H) at high-magnification, as illustrated on panel (I). Images were acquired from 30 μm whole-body cryosections. Cryosection showing the ILT (A) and ALT (B) of mhc2:GFP (cyan hot) zebrafish stained with DAPI (red) reveal numerous mhc2 expressing cells. Purple arrowheads point to GFP positives pavement cells, green arrowheads highlight GFP low reticulated epithelial cells and yellow arrows indicate the presence of large GFP positive cells. (C, D) Cryosections from mhc2:GFP (green) zebrafish gills, stained with fluorescent peanut agglutinin lectins (red) and DAPI (blue), show the presence of dendritic cells among the ILT and ALT (cyan arrowheads), and the presence of small GFP+ cells displaying a lymphocyte-like morphology (cyan stars). To note, the peanut agglutinin lectin also binds to the surface of some pavement cells (magenta arrows). (E, F) Cryosections from mfap4:mCherry-F zebrafish, whose macrophages are fluorescent, stained with phalloidin (green) and DAPI (blue), identify the presence of many macrophages (red hot) within the ILT and ALT (cyan arrows). (G, H) Cryosections from mpx:GFP zebrafish, whose neutrophils are fluorescent, stained with phalloidin (green) and DAPI (blue), identify the presence of neutrophils (red hot) within the ILT and ALT (red arrows). Images are maximum intensity projections: 2 µm (A–D, G, H), 4 µm (F) and 9 µm (E). Annotations: Aa, Afferent artery; ALT, Amphibranchial Lymphoid Tissue; Bc, Branchial cavity; C, Cartilage; Ea, Efferent artery; Ga, Gill arch; ILT, Interbranchial Lymphoid Tissue; La, Lamella; Rbc, Red blood cells; Rc, Rodlet cells and Vb, Vascular bleb. Scale bars: 10 µm (A–D, H), 20 μm (F, G) and 40 µm (E).

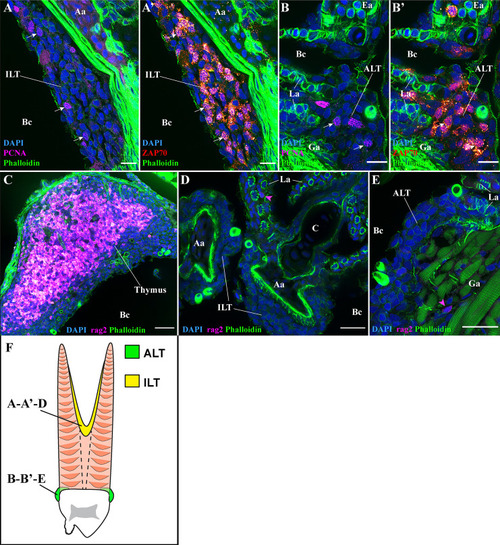
T/NK cell proliferation and RAG2 expression. Representative deconvolved confocal images of adult zebrafish gills displaying the ILT (A, A’, D), the ALT (B, B’, E), as illustrated on panel (F), and the thymus (C), at high-magnification. Images were acquired from 30 μm whole-body cryosections stained with phalloidin (green) and DAPI (blue). (A, B’) Co-labeling of T/NK cells with an anti-ZAP70 antibody (red hot), and of proliferating cells with an anti-PCNA antibody (magenta). Proliferating T/NK cells in the ILT and ALT are highlighted by white arrows in (A, A’, B, B’). (C–E) Cryosections from rag2:DsRED zebrafish where cells going through V(D)J recombination are fluorescent (magenta hot). Expression of rag2 is very high within the thymus but only a few cells with low signal are present around the ILT and ALT (magenta arrowheads in (D, E). Images are maximum intensity projections: 2 µm (A–E). Annotations: Aa, Afferent artery; ALT, Amphibranchial Lymphoid Tissue; Bc, Branchial cavity; C, Cartilage; Ea, Efferent artery; Ga, Gill arch; ILT, Interbranchial Lymphoid Tissue and La, Lamella. Scale bars: 10 µm (A, B’), 20 μm (D, E) and 30 µm (C).

Modifications of the zf-GIALT structure upon SVCV infection. Representative deconvolved confocal images of adult zebrafish gills 3 days (A–E) and 10 days (F–J) post-infection with the Spring Viraemia of Carp Virus (SVCV). Images were acquired from 30 μm whole-body cryosections stained with phalloidin (green) and DAPI (blue) and where T/NK cells were labeled with anti-ZAP70 antibody (red hot). (A) Low magnification image of a gill arch illustrating the overall reduced number of T/NK cells in the gills 3 days after infection. This depletion of T/NK cells is particularly striking within the ALT (B, C) and the ILT (D, E). Yellow arrowheads in (A) point to T/NK cells adhering to the endothelium of blood vessels. (F) Low magnification image of two gill arches illustrating the replenishment of the zf-GIALT 10 days after infection. The number of T/NK cells within the ALT (G, H) and the ILT (I, J) is a lot higher; and T/NK cells form small clusters (cyan arrowheads in H, I and J). Images are maximum intensity projections: 2 µm (B–E, G–J) and 5 µm (A, F). Annotations: Aa, Afferent artery; Aaa, Afferent arch artery; ALT, Amphibranchial Lymphoid Tissue; Bc, Branchial cavity; C, Cartilage; Ea, Efferent artery; Ga, Gill arch; ILT, Interbranchial Lymphoid Tissue; La, Lamella; S, Septum and Vb, Vascular bleb. Scale bars: 10 µm (H), 20 μm (B–E, G, I, J) and 50 µm (A, F).

The ALT is a preserved structure between distant teleost species. Representative acquisitions of anti-ZAP70 (brown/red hot) labeled gills section, from different fish species, displaying the side of a gill arch, at the base of filaments. (A, B) ALT of the European carp (Cyprinus carpio); Cyprinid – Paraffin section. (C) ALT of the Atlantic salmon (Salmo salar L.); Salmonid – cryosections stained with phalloidin (green) and DAPI (blue). (D) ALT of the Atlantic mackerel (Scomber scombrus); Scombridae, Percomorph – Paraffin section. (E) ALT of the Northern red snapper (Lutjanus campechanus); Lutjanidae, Percomorph – Paraffin section. (F) ALT of the Pacific barracuda (Sphyraena argentea); Sphyraenidae, Percomorph – Paraffin section. (G) ALT of the Medaka (Oryzias latipes); Adrianichthyidae, Percomorph - cryosections stained with phalloidin (green) and DAPI (blue). These images are maximum intensity projections: 2 µm (G) and 5 µm (C). Annotations: ALT, Amphibranchial Lymphoid Tissue; Bc, Branchial cavity; Bm, Basement membrane; Ea, Efferent artery; Ep, Epithelial cells; F, Filament; Ga, Gill arch; Gr, Gill raker; La, Lamella; S, Septum and Sm, Smooth muscles. Scale bars: 50 µm (B, G) and 70 μm (A, C).

Acknowledgments
This image is the copyrighted work of the attributed author or publisher, and ZFIN has permission only to display this image to its users. Additional permissions should be obtained from the applicable author or publisher of the image. Full text @ Front Immunol