
- Title
-
Reduction of breast tumor drug resistance by 2,3,5,4'-tetrahydroxystilbene for exhibition synergic chemotherapeutic effect
- Authors
- Chang, Y.Y., Lin, H.J., Hsiao, L.C., Lin, Y.F., Chang, C.S., Liu, D.Z.
- Source
- Full text @ PLoS One
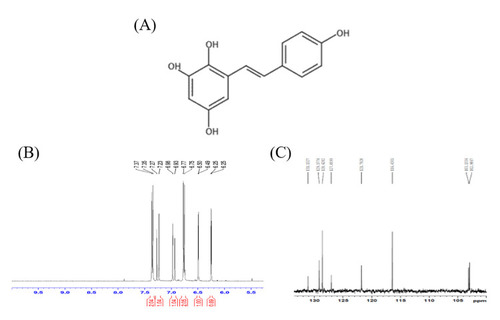
(A) Structure of TG1. (B) 1H NMR analysis of TG1. (C) 13C NMR analysis of TG1. |
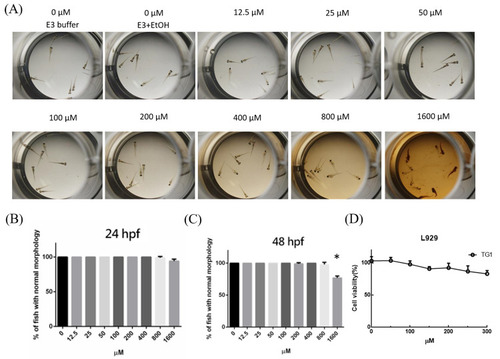
The effects of TG1 on the development of zebrafish embryos.
(A) Representative images of zebrafish embryos exposed to TG1 at 48h. Survival rate after exposure to 12.5uM to 1600uM TG1 at (B) 24 and (C) 48 hpf. (D) Inhibition of TG1 on cell viability of L929 cells. (E3: E3 medium, for zebrafish embryos; EtOH: ethanol; hpf: hours post fertilisation) Data were shown by mean � SD (standard deviation), n = 3. *p< 0.01, which indicated the groups had significant difference as comparing to control group. |
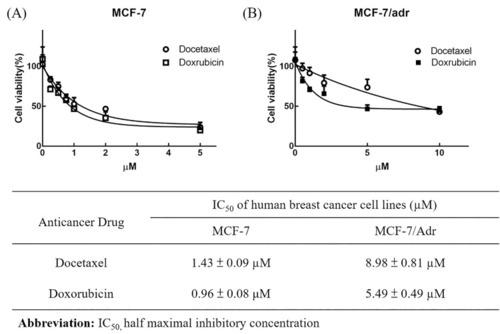
Inhibition of DOX or DTX on proliferation of (A) MCF-7 and (B) MCF-7/Adr cells. The IC50 values of DOX or DTX were calculated and showed on table. Data were shown by mean ± SD, n = 3. |
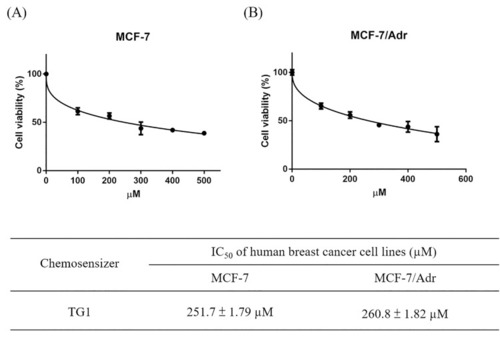
Inhibition of TG1 on proliferation of (A) MCF-7 and (B) MCF-7/Adr cells. The IC50 values of TG1 were calculated and showed on table. Data were shown by mean ± SD, n = 3. |
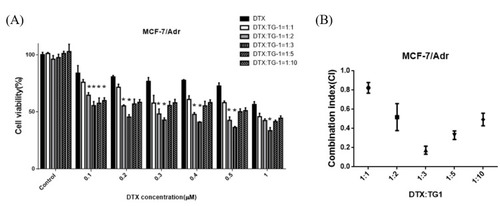
Combined effects of TG1 and DTX on inhibiting cell proliferation of MCF-7/Adr for 24 hours.
(A)The cells were treated to different concentrations of DTX or combined with the chemosensitizer, TG1, in molar ratios of 1:1, 1:2, 1:3, 1:4 1:5 and 1:10. (B) Combination index of DTX and TG1 on different molar ratios for treating MCF-7/Adr cells. Data are shown as mean � SD, n = 5. *p< 0.01, indicating significant differences between experimental and control groups. |
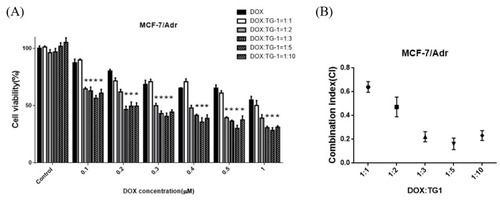
Combined effects of TG1 and DOX on inhibiting cell proliferation of MCF-7/Adr for 24 hours.
(A)The cells were treated to different concentrations of DOX or combined with the chemosensitizer, TG1, in molar ratios of 1:1, 1:2, 1:3, 1:4 1:5 and 1:10. (B) Combination index of DOX and TG1 on different molar ratio for treating MCF-7/Adr cells. Data are shown by mean � SD, n = 5. *p< 0.01, indicating significant differences between experimental and control groups. |
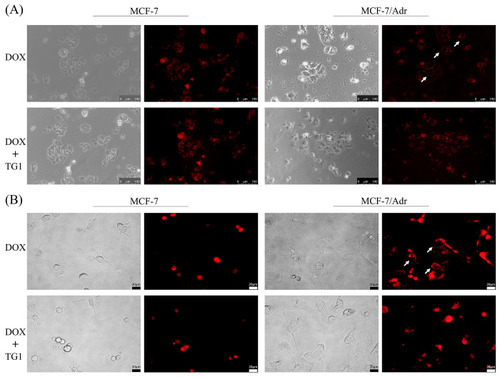
Fluorescence images of cellular uptake of DOX or DOX combined with TG1 in MCF-7 and MCF-7/Adr by inverted fluorescence microscope.
(A) 20x images (B) 40x images. |
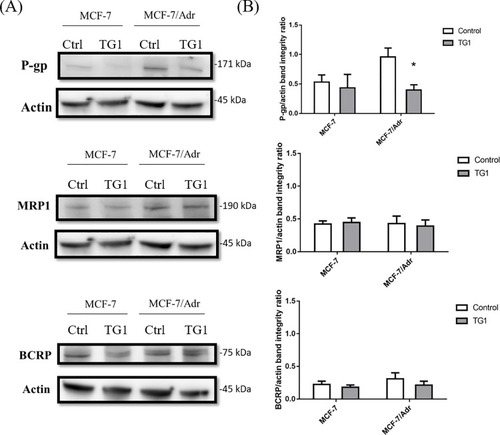
Effect of TG1 on expression of MDR related transporter in MCF or MCF-7/Adr cells.
(A) Expression of P-gp, MRP1 and BCRP using western blot on MCF-7 or MCF-7/Adr cells. (B) Quantitative data are shown as mean � SD, n = 3. *p< 0.01, which indicates significant differences between the experimental and control groups. |
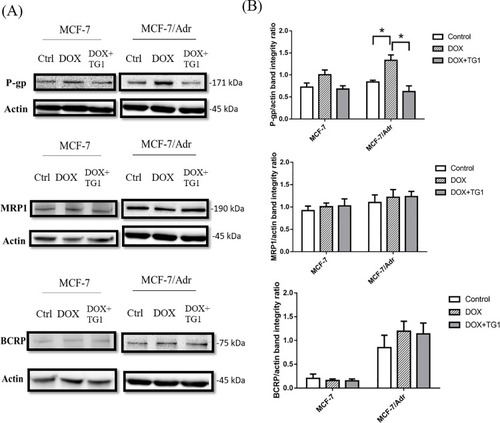
Effects of DOX combined with TG1 on expression of MDR related transporter in MCF-7 or MCF-7/Adr cells.
(A) Expression of P-gp, MRP1 and BCRP using western blot on MCF-7 or MCF-7/Adr cells. (B) Quantitative data are shown as mean � SD, n = 3. *p< 0.01, which indicates significant differences between experimental and control groups. |