
Image
|
Figure Caption
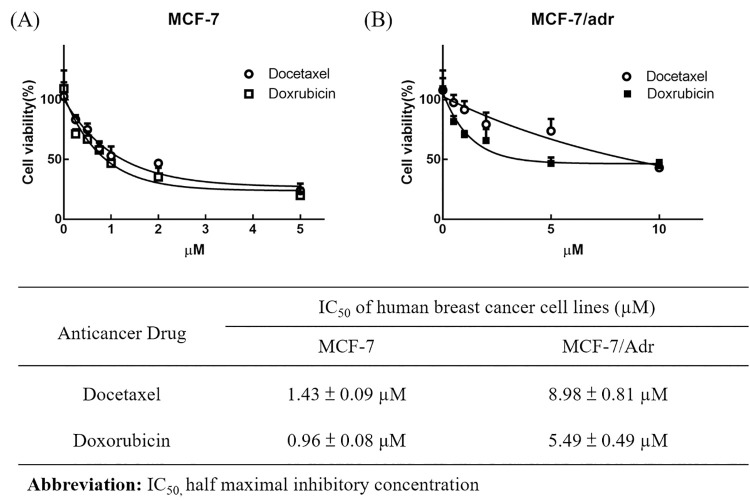
Fig 3
Inhibition of DOX or DTX on proliferation of (A) MCF-7 and (B) MCF-7/Adr cells. The IC50 values of DOX or DTX were calculated and showed on table. Data were shown by mean ± SD, n = 3.
Acknowledgments
This image is the copyrighted work of the attributed author or publisher, and
ZFIN has permission only to display this image to its users.
Additional permissions should be obtained from the applicable author or publisher of the image.
Full text @ PLoS One