
FIGURE
Fig 2
Fig 2
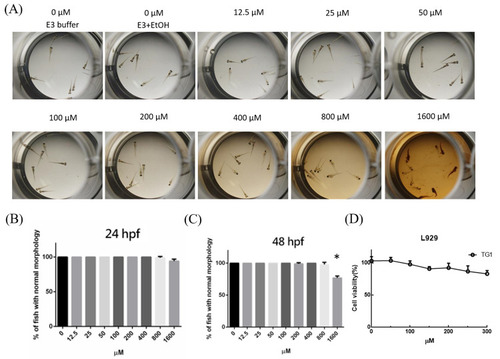
The effects of TG1 on the development of zebrafish embryos.
(A) Representative images of zebrafish embryos exposed to TG1 at 48h. Survival rate after exposure to 12.5uM to 1600uM TG1 at (B) 24 and (C) 48 hpf. (D) Inhibition of TG1 on cell viability of L929 cells. (E3: E3 medium, for zebrafish embryos; EtOH: ethanol; hpf: hours post fertilisation) Data were shown by mean ± SD (standard deviation), n = 3. *p< 0.01, which indicated the groups had significant difference as comparing to control group. |
Expression Data
Expression Detail
Antibody Labeling
Phenotype Data
Phenotype Detail
Acknowledgments
This image is the copyrighted work of the attributed author or publisher, and
ZFIN has permission only to display this image to its users.
Additional permissions should be obtained from the applicable author or publisher of the image.
Full text @ PLoS One