
- Title
-
Identification of the Antithrombotic Mechanism of Leonurine in Adrenalin Hydrochloride-Induced Thrombosis in Zebrafish via Regulating Oxidative Stress and Coagulation Cascade
- Authors
- Liao, L., Zhou, M., Wang, J., Xue, X., Deng, Y., Zhao, X., Peng, C., Li, Y.
- Source
- Full text @ Front Pharmacol
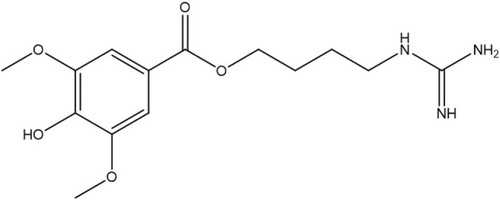
Chemical structure of LEO. |
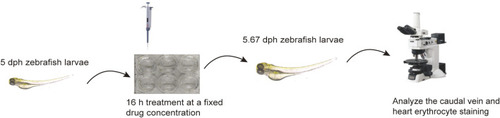
The procedure of LEO antithrombotic experimental assay. |
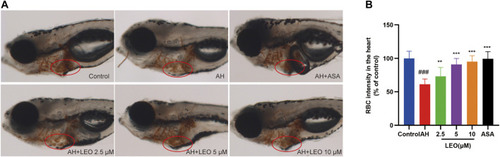
Effect of LEO on AH-induced thrombosis in zebrafish larvae. |
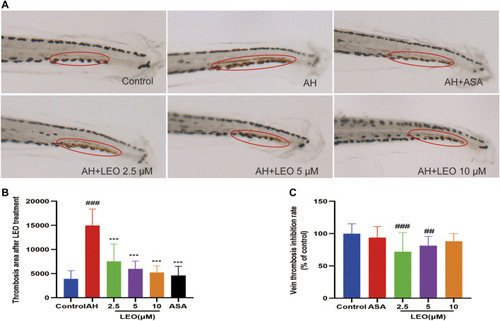
Effect of LEO on AH-induced thrombosis in zebrafish larvae. |
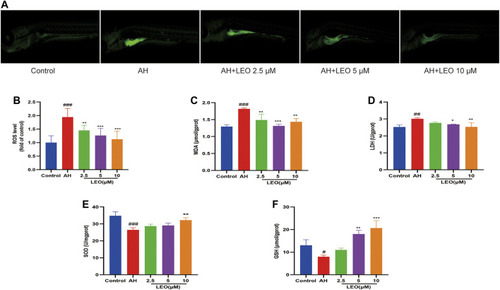
LEO inhibit oxidative damage. |
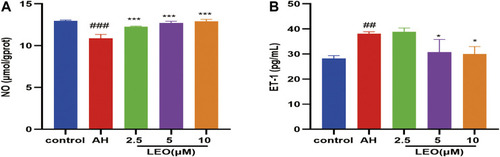
Effect of LEO on NO and ET-1 levels in zebrafish treated with AH. |
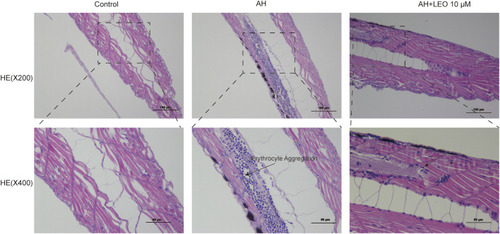
Effect of LEO on the H&E staining of tail vein in zebrafish larval (×200 and ×400). The blue dots represent erythrocyte. |
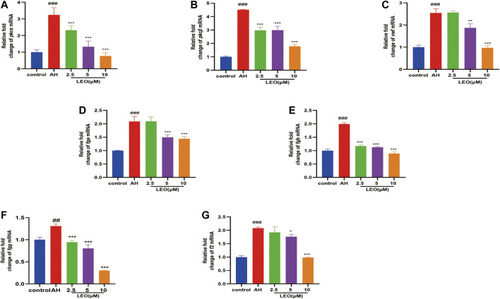
The related mRNA expression of platelet activity and coagulation cascade in control group, AH group and AH + LEO (2.5, 5, 10 μM) groups. |
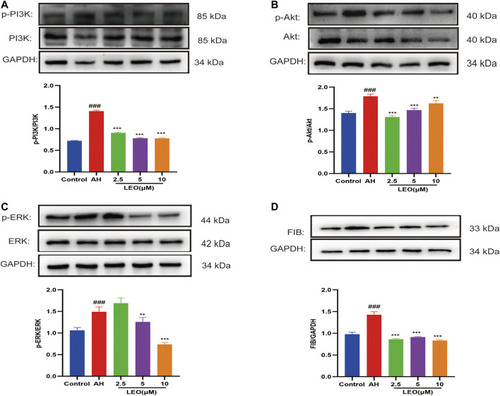
The expression of related protein in control group, AH group and AH + LEO (2.5, 5, 10 μM) groups. |
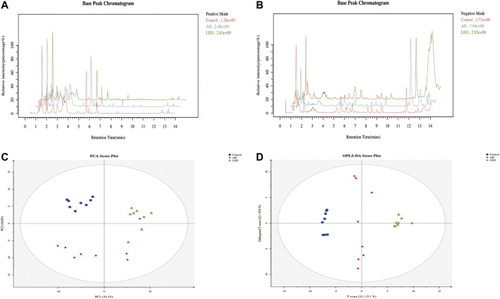
Metabolomic analysis of zebrafish larvae samples from control, AH, and LEO groups. |
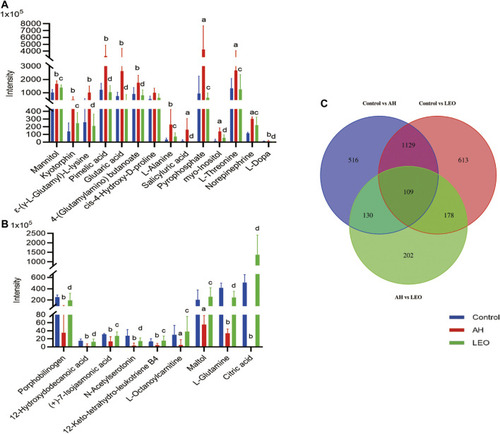
The normalized intensity of differential metabolites in control, AH and LEO groups. |
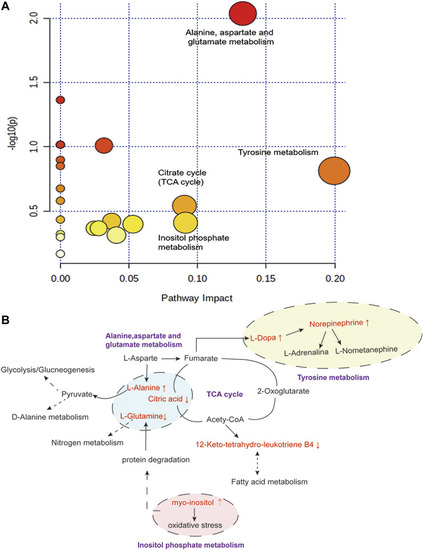
Disturbed pathway in response to AH-induced thrombosis and LEO treatment. |
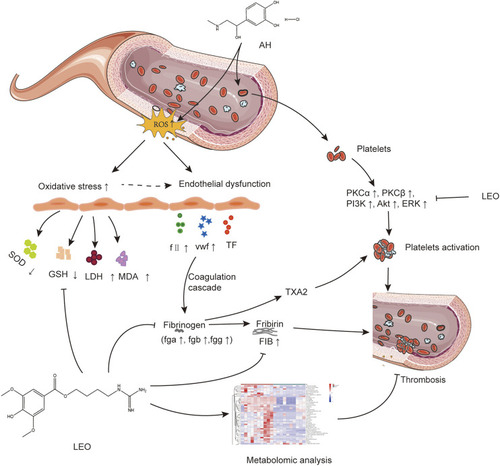
The potential mechanism linking dysregulated oxidative stress, platelets activation, and coagulation cascade with thrombosis. |