
FIGURE
FIGURE 11
- ID
- ZDB-FIG-211129-56
- Publication
- Liao et al., 2021 - Identification of the Antithrombotic Mechanism of Leonurine in Adrenalin Hydrochloride-Induced Thrombosis in Zebrafish via Regulating Oxidative Stress and Coagulation Cascade
- Other Figures
- All Figure Page
- Back to All Figure Page
FIGURE 11
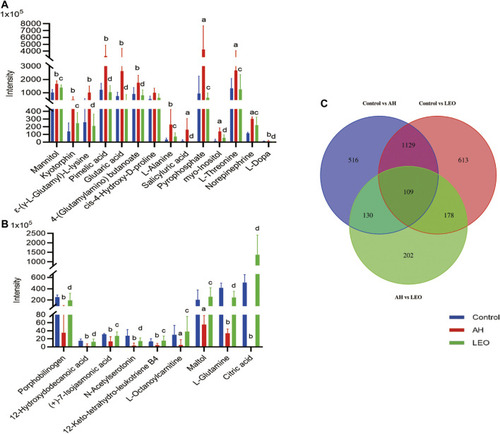
The normalized intensity of differential metabolites in control, AH and LEO groups. |
Expression Data
Expression Detail
Antibody Labeling
Phenotype Data
Phenotype Detail
Acknowledgments
This image is the copyrighted work of the attributed author or publisher, and
ZFIN has permission only to display this image to its users.
Additional permissions should be obtained from the applicable author or publisher of the image.
Full text @ Front Pharmacol