
Image
|
Figure Caption
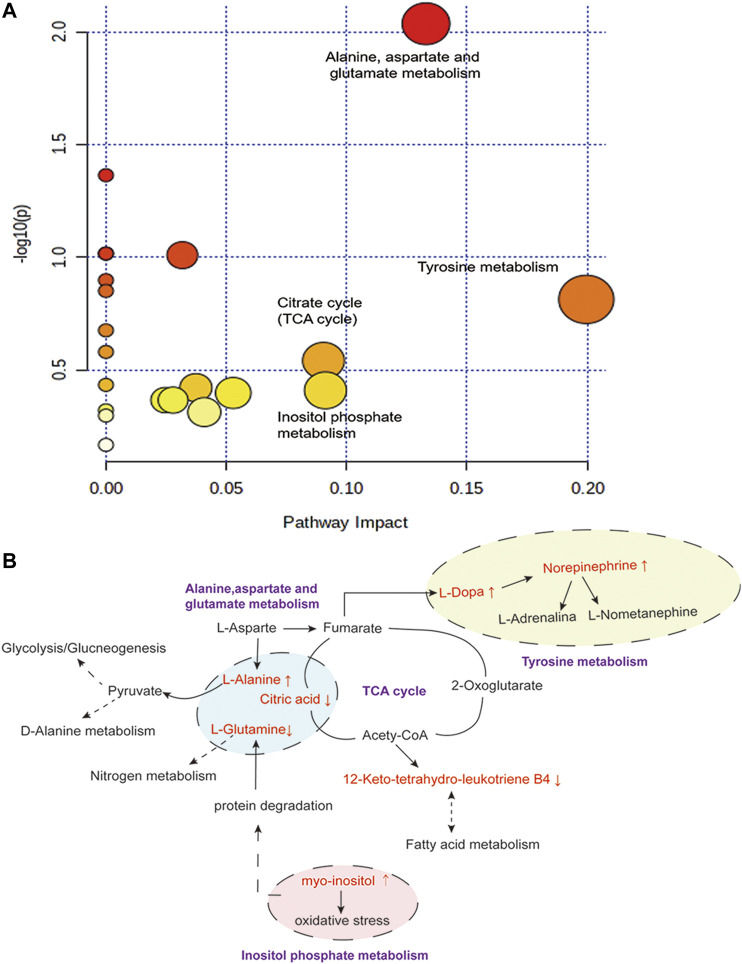
FIGURE 12
Disturbed pathway in response to AH-induced thrombosis and LEO treatment.
Acknowledgments
This image is the copyrighted work of the attributed author or publisher, and
ZFIN has permission only to display this image to its users.
Additional permissions should be obtained from the applicable author or publisher of the image.
Full text @ Front Pharmacol