
- Title
-
NAMPT-derived NAD+ fuels PARP1 to promote skin inflammation through parthanatos cell death
- Authors
- Martínez-Morcillo, F.J., Cantón-Sandoval, J., Martínez-Navarro, F.J., Cabas, I., Martínez-Vicente, I., Armistead, J., Hatzold, J., López-Muñoz, A., Martínez-Menchón, T., Corbalán-Vélez, R., Lacal, J., Hammerschmidt, M., García-Borrón, J.C., García-Ayala, A., Cayuela, M.L., Pérez-Oliva, A.B., García-Moreno, D., Mulero, V.
- Source
- Full text @ PLoS Biol.
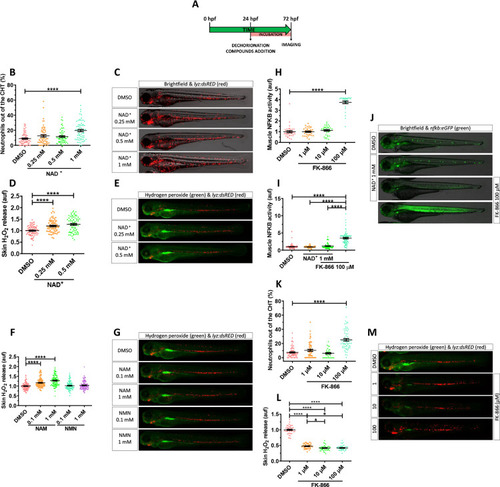
NAD+ metabolites regulate skin oxidative stress and inflammation.
(A) Embryos of 24 hpf were manually dechorionated, treated for 48 hours with NAD+ metabolites or FK-866 by bath immersion, and images obtained at 72 hpf. (B–M) Quantification of the percentage of neutrophils out of the CHT in embryos treated with NAD+ (0.25, 0.5 and 1 mM) (B). Representative merge images (brightfield and red channel) of lyz:dsRED zebrafish larvae of every group are shown (C). For H2O2 imaging, embryos were incubated in 50 μM of acetyl-pentafluorobenzene sulphonyl fluorescein solution for 1 hour. Quantification of fluorescence intensity for NAD+-mediated (D) and NAM-/NMN-mediated (F) induction of H2O2 in the zebrafish skin. Representative merge images (green and red channel) of lyz:dsRED zebrafish larvae of every group are shown (E, G). NFKB activity was determined by quantification of fluorescence intensity in embryos treated with increasing doses of FK-866 (1, 10, and 100 μM) (H). Additionally, the influence of NAD+ in the presence or absence of 100 μM FK-866 was assayed (I). Representative images (brightfield and green channel) of nfkb:eGFP zebrafish larvae of every group are shown (J). Neutrophil distribution in zebrafish embryos of 3 dpf treated with FK-866 (K), quantification of skin H2O2 production (L), and representative merge images (green and red channel) of lyz:dsRED zebrafish larvae of every group are shown (M). Each dot represents 1 individual and the mean ± SEM for each group is shown. p-Values were calculated using 1-way ANOVA and Tukey multiple range test. *p ≤ 0.05, ****p ≤ 0.0001. The data underlying this figure can be found in S1 Data. ANOVA, analysis of variance; CHT, caudal hematopoietic tissue; NAD+, nicotinamide adenine dinucleotide; NAM, nicotinamide; NMN, nicotinamide mononucleotide. EXPRESSION / LABELING:
PHENOTYPE:
|
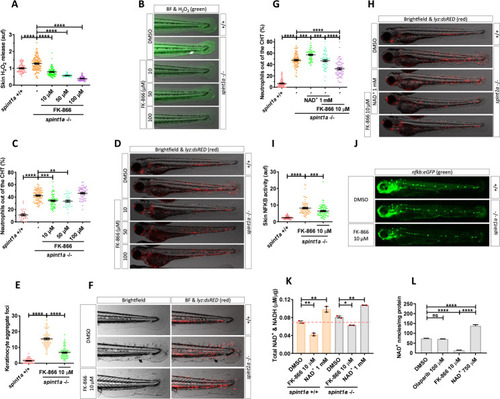
Pharmacological inhibition of Nampt alleviates stress and skin inflammation in Spint1a-deficient larvae.
(A) Quantification of skin H2O2 production in wild-type and Spint1a-deficient zebrafish larvae treated with FK-866 (0, 10, 50, and 100 μM). (B) Representative merge images (brightfield and green channel) of zebrafish larvae of every group are shown. The white arrow indicates a keratinocyte aggregate where H2O2 release was high. (C) Neutrophil distribution of wild-type and Spint1a-deficient zebrafish larvae treated with increasing doses of FK-866. (D) Representative merge images (brightfield and red channel) of lyz:dsRED zebrafish larvae of every group are shown. (E) Number of keratinocyte aggregates in the tail skin of larvae treated with 10 μM FK-866. (F) Detailed representative merge images (brightfield and red channel) of the tail of wild-type and Spint1a-deficient larvae treated with vehicle (DMSO) or 10 μM FK-866. Black arrows indicate keratinocyte aggregates and immune cell recruitment presents in nontreated Spint1a-deficient skin. (G) Neutrophil distribution of zebrafish embryos treated with 1 mM NAD+ in the presence or absence of 10 μM FK-866. (H) Representative merge images (brightfield and red channels) of lyz:dsRED zebrafish larvae of every group are shown. (I) Quantification of fluorescence intensity of wild-type and Spint1a-deficient embryos treated with 10 μM FK-866. (J) Representative images (green channel) of NF-kB:eGFP zebrafish larvae of every group are shown. (K) Wild-type and Spint1a-deficient larvae of 72 hpf treated for 48 hours with 10 μM FK-866 and 1 mM NAD+ were used for total NAD+ and NADH determination by ELISA. (L) Spint1a-deficient larvae of 72 hpf treated for 48 hours with 100 μM olaparib, 10 μM FK-866 and 750 μM NAD+ were used for NAD+ determination by enzymatic cycling method. Each dot represents one individual, and the mean ± SEM for each group is also shown. p-Values were calculated using 1-way ANOVA and Tukey multiple range test. ns, not significant, **p ≤ 0.01, ***p ≤ 0.001, ****p ≤ 0.0001. The data underlying this figure can be found in S1 Data. ANOVA, analysis of variance; NAD+, nicotinamide adenine dinucleotide; Nampt, nicotinamide phosphoribosyltransferase. PHENOTYPE:
|

NADPH oxidase–derived ROS promote skin inflammation in Spint1a-deficient larvae.
Quantification of neutrophil dispersion out of CHT of wild-type and Spint1a-deficient embryos treated with 100 μM NAC (A), 100 μM mito-TEMPO (MT) and 100 nM tempol (T) (C), 250 μM apocynin (G), or upon genetic inactivation of nox1 and nox5 (I, J) and nox4 (I, M) with CRISPR/Cas-9. Representative merge images (brightfield and red channels) of lyz:dsRED zebrafish larvae of every group are shown (B, D, F, H, K, M). Determination of NFKB transcriptional activity in the skin of embryos treated with MT and T (E) and representative images (green channel) of nfkb:eGFP zebrafish larvae of every group (F). Each dot represents one individual, and the mean ± SEM for each group is also shown. p-Values were calculated using 1-way ANOVA and Tukey multiple range test and t test. ns, not significant, **p ≤ 0.01, ****p ≤ 0.0001. The data underlying this figure can be found in S1 Data. ANOVA, analysis of variance; CHT, caudal hematopoietic tissue; NAC, N-acetylcysteine; ROS, reactive oxygen species. PHENOTYPE:
|
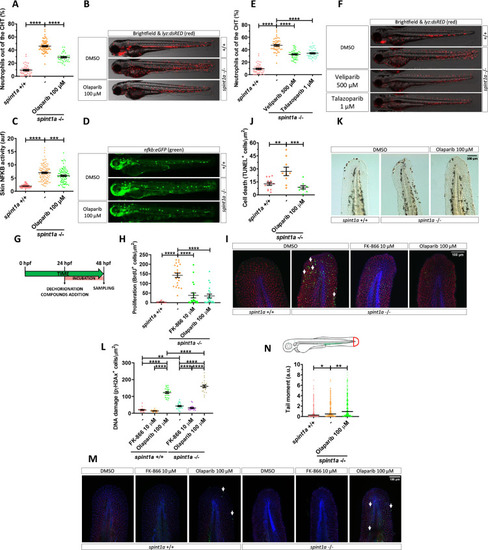
Pharmacological inhibition of Nampt and Parp1 alleviates skin oxidative stress and inflammation and keratinocyte cell death, hyperproliferation and DNA damage in Spint1a-deficient larvae.
Analysis of neutrophil distribution (A, E) and NFKB transcriptional activity in the skin (C) of wild-type and Spint1a-deficient larvae treated with olaparib (A, C), and veliparib or talazoparib (E). Representative images (brightfield and red channel in B, F; green channel in D) of lyz:dsRED and nfkb:eGFP zebrafish larvae of every group are shown. Determination of BrdU positive cells from 48 hpf wild-type and Spint1a-deficient zebrafish larvae treated for 24 hours with 10 μM FK-866 or 100 μM olaparib (G, H). Representative merge images maximum intensity projection of a confocal Z stack from zebrafish larvae of every group are shown (I). WIHC with anti-BrdU (green, arrows), anti-p63 (red, basal keratinocyte marker) were counterstained with DAPI (blue). Quantification of TUNEL positive cells from 48 hpf wild-type and Spint1a-deficient zebrafish larvae treated for 24 hours with 100 μM olaparib (J). Representative images of zebrafish larvae of every group are shown (K). Quantification of pγH2Ax positive cells from 48 hpf wild-type and Spint1a-deficient zebrafish larvae treated for 24 hours with 10 μM FK-866 or 100 μM olaparib (L). Similarly, around 60 zebrafish tail folds (red boxed area) were amputated and disaggregated into cells for comet assay analysis in alkaline conditions (N). Representative merge images of maximum intensity projection of an apotome Z stack from zebrafish larvae of every group are shown (M). WIHC with anti-pγH2Ax (green, arrows), anti-P63 (basal keratinocyte marker, red) were counterstained with DAPI (blue). Scale bars, 100 μm. Each dot represents one individual. The mean ± SEM (A-L) and median (N) for each group is shown. p-Values were calculated using 1-way ANOVA and Tukey multiple range test (A-L) and Kruskal–Wallis test and Dunn multiple comparisons test (N). *p ≤ 0.05, **p ≤ 0.01, ***p ≤ 0.001, ****p ≤ 0.0001. The data underlying this figure can be found in S1 Data. ANOVA, analysis of variance; Nampt, nicotinamide phosphoribosyltransferase; Parp1, Poly(ADP-Ribose) polymerase 1; TUNEL, terminal deoxynucleotidyl transferase dUTP nick end labeling. EXPRESSION / LABELING:
PHENOTYPE:
|
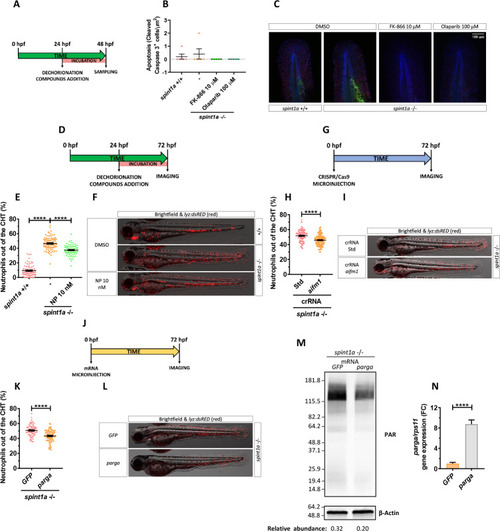
Inhibition of parthanatos rescues skin inflammation of Spint1a-deficient larvae.
(A, B) Quantification of cleaved caspase 3 positive cells from 48 hpf wild-type and Spint1a-deficient larvae treated for 24 hours with 10 μM FK-866 or 100 μM olaparib. (C) Representative merge images of maximum intensity projection of an apotome Z stack from zebrafish larvae of every group are shown. WIHC with anti-cleaved Casp3 (green) and anti-P63 (basal keratinocyte marker, red) were counterstained with DAPI (blue). (D–N) Pharmacological and genetic inhibition experimental settings (D, G, J). Quantification of the percentage of neutrophils out of the CHT in embryos treated with 10 nM NP (Aifm1 translocation inhibitor) (E), aifm1 genetic inhibition (H) and parga mRNA overexpression (K). Representative merge images (brightfield and red channels) of lyz:dsRED zebrafish larvae of every group are shown (F, I, L). For mRNA overexpression, 1-cell stage zebrafish eggs were microinjected, and imaging was performed in 3dpf larvae (J). Western blots with anti-PAR and anti-β-actin of tail fold lysates from 3 dpf wild-type and Spint1a-deficient zebrafish larvae microinjected with parga or GFP mRNA. The relative abundance of PAR with respect to β-actin is shown in each lane (M). Relative mRNA levels of 3 dpf wild-type zebrafish larvae microinjected with parga or GFP mRNA (N). Each dot represents one individual, and the mean ± SEM for each group is also shown. p-Values were calculated using 1-way ANOVA and Tukey multiple range test and t test. ****p ≤ 0.0001. The data underlying this figure can be found in S1 Data. ANOVA, analysis of variance; CHT, caudal hematopoietic tissue; NP, N-phenylmaleimide. |
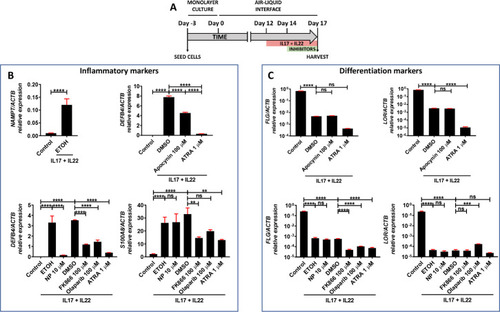
Reduction of pathology-associated gene expression in human organotypic 3D skin models of psoriasis.
(A–C) Transcript levels of the indicated genes encoding inflammation (B) and differentiation (C) markers were determined in human organotypic 3D skin models pretreated with 30 ng/ml IL17A and IL22 in the presence of vehicles (ETOH and DMSO) or the indicated inhibitors. The mean ± SEM for each group is shown. The results are representative of 3 independent experiments. p-Values were calculated using 1-way ANOVA and Tukey multiple range test. ns, not significant. *p ≤ 0.05, **p ≤ 0.01, ***p ≤ 0.001, ****p ≤ 0.0001. The data underlying this figure can be found in S1 Data. ANOVA, analysis of variance; ATRA, all-trans retinoic acid; NP, N-phenylmaleimide. |

Robust increase of NAMPT protein amount, PARylation, and nuclear translocation of AIFM1 in lesional skin from psoriasis patients.
(A–C) Representative images of sections from healthy and psoriatic skin biopsies that have been immunostained with an anti-NAMPT (A), anti-poly (ADP-ribose) (B), or anti-AIFM1 monoclonal antibodies and then slightly counterstained with hematoxilin (A, B) or DAPI (C). (D) The percentage of nuclear AIFM1 positive cells (white arrows) in human skin biopsies was calculated as the ratio between the number of keratinocytes in which AIFM1 is found in the nucleus and total keratinocyte number. Each point represents the mean of the quantification of 30 to 60 fields in section from an individual, and the mean ± SEM for each group is also shown. p-Values were calculated using t test. ***p ≤ 0.001. Scale bar is 40 μm in A, 100 μm and 50 μm in left and right panels of B and 10 μm in C. The data underlying this figure can be found in S1 Data. CL, cornified layer; D, dermis; Nampt, nicotinamide phosphoribosyltransferase; SL, spinous layer. |
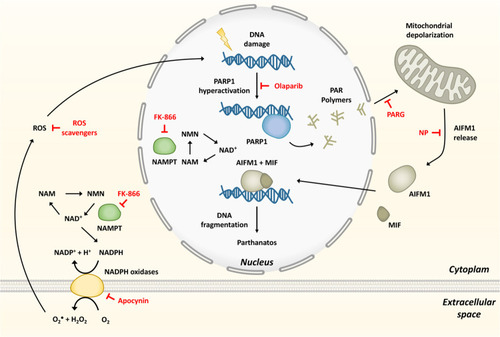
Model showing that hyperactivation of PARP1 in response to ROS-induced DNA damage, and fueled by NAMPT-derived NAD+, mediates inflammation through parthanatos.
The inhibitors used are depicted in red. MIF, migration inhibitory factor; NAD+, nicotinamide adenine dinucleotide; NAM, nicotinamide; NAMPT, nicotinamide phosphoribosyltransferase; NMN, nicotinamide mononucleotide; NP, N-phenylmaleimide; Parp1, Poly(ADP-Ribose) polymerase 1; ROS, reactive oxygen species. |