
- Title
-
Origami: Single-cell 3D shape dynamics oriented along the apico-basal axis of folding epithelia from fluorescence microscopy data
- Authors
- Mendonca, T., Jones, A.A., Pozo, J.M., Baxendale, S., Whitfield, T.T., Frangi, A.F.
- Source
- Full text @ PLoS Comput. Biol.

a. Airyscan confocal fluorescence micrograph (maximum intensity projection (MIP) of 35 z-slices) of the developing zebrafish otic vesicle at 51.5 hours post fertilisation. Red box—anterior projection; yellow box—endolymphatic sac; cyan box—posterior projection. The ROIs are expanded alongside—top row MIPs, and bottom row single slices. Scale bars: 20 μm. Blue arrows mark the direction of apicobasal polarity (pointing towards the apical side). b. Polarity assignment on segmented data; ROI surrounding the anterior projection was segmented (here overlaid on the MIP) using ACME, centroids were generated for each segmented cell and a triangular surface mesh was produced from these centroids. Normal vectors (blue arrows) to this surface mesh represent the apico-basal axis. c. Cell shape features were computed concerning the assigned apico-basal axis; here, three example cells are highlighted, alongside a 3D rendering showing their position in the anterior projection and the corresponding shape metrics in a table. |

a. Surface meshes of synthetic epithelia for validating the Origami analysis pipeline. Alongside, 3D rendering of one of the synthetic epithelia (top) and a single 2D slice through it (bottom). Each image volume was corrupted with three levels of noise. b. The relationship between surface geometry/noise and segmentation quality. Error bars represent the standard deviation. Tukey’s pairwise comparisons with significant values depicted with asterisks: Dice score at radius of curvature of 200 μm (1000 pixels) compared to that at 106 μm (530 pixels)– |
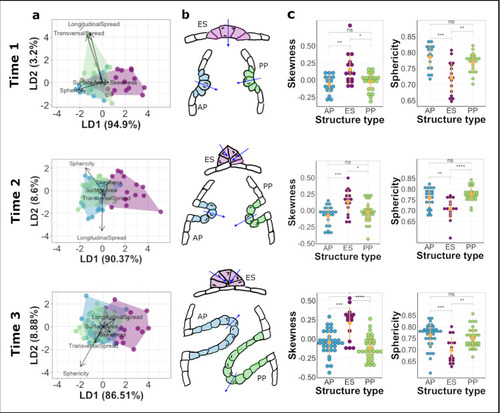
Rows represent each time point analysed. Data in blue represent cells from AP, green represent cells from PP and magenta represent ES. a. Linear discriminate analysis (LDA) biplots illustrate multivariate clustering of data—data from AP and PP show considerable overlap indicating similar shape signatures while data from ES show less overlap with the former. b. Schematic illustrations of cell shape signatures at the time points analysed showing cells in the ES having skew in the opposite direction to those in the projections and having less rounded shapes. Arrows indicate apico-basal polarity. c. Plots showing differences in skewness and sphericity between the structures at the time points analysed. Yellow dots with error lines represent mean and standard deviation for the data. |