
- Title
-
Exercise Intervention Mitigates Pathological Liver Changes in NAFLD Zebrafish by Activating SIRT1/AMPK/NRF2 Signaling
- Authors
- Zou, Y., Chen, Z., Sun, C., Yang, D., Zhou, Z., Peng, X., Zheng, L., Tang, C.
- Source
- Full text @ Int. J. Mol. Sci.
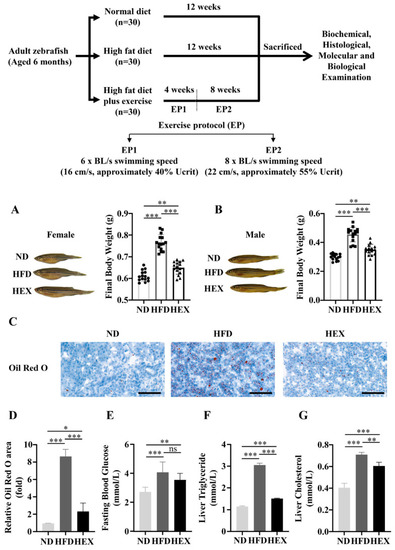
Zebrafish receiving a high exercise regimen (HEX) had reduced body weight gain and lipid accumulation compared to high-fat diet (HFD) zebrafish. Normal diet (ND) zebrafish represent the control group. (A,B) Morphology and body weight of zebrafish. (C) Oil Red O staining of zebrafish livers (n = 3). (D) Quantitation of Oil Red O staining. (E) Fasting blood glucose (ND, n = 13; HFD, n = 10; HEX, n = 11). (F) Liver triglyceride (n = 5). (G) Liver cholesterol (n = 5). The above experiments were carried out using 9-month-old zebrafish. *, p < 0.05, **, p < 0.01, ***, p < 0.001. Data represent the mean, and error bars represent SEM. Scale bar, 20 ?m. NAFLD, non-alcoholic fatty liver disease; ND, normal diet; HFD, high fat diet; HEX, high-fat diet plus exercise. |
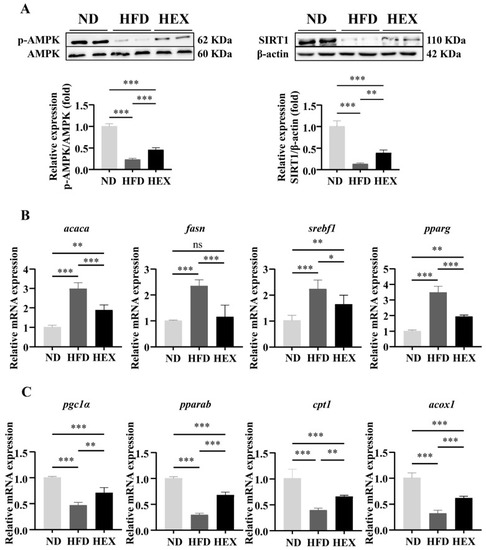
SIRT1/AMPK signaling and lipid metabolism in zebrafish livers. (A) Western blot representing SIRT1/AMPK signaling in 9-month-old zebrafish livers (n = 8). (B) Expression of lipogenesis-related genes (n = 6). (C) Expression of ?-oxidation-related genes in 9-month-old zebrafish livers (n = 6). *, p < 0.05, **, p < 0.01, ***, p < 0.001. Data represents the mean, and error bars represent SEM. NAFLD, non-alcoholic fatty liver disease; ND, normal diet; HFD, high fat diet; HEX, high-fat diet plus exercise. |
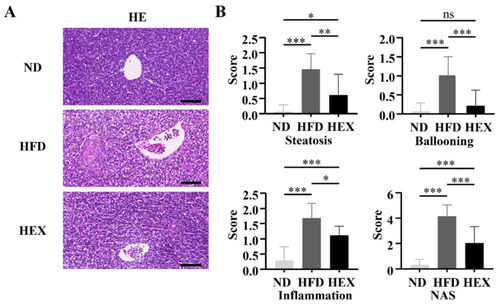
Quantitation of pathological changes in zebrafish livers. (A) H&E staining of 9-month-old zebrafish livers (n = 3). (B) NAFLD activity scores. *, p < 0.05, **, p < 0.01, ***, p < 0.001. Data represent the mean and error bars represent SEM. Scale bar, 20 ?m. NAFLD, non-alcoholic fatty liver disease; ND, normal diet; HFD, high fat diet; HEX, high-fat diet plus exercise. |

Quantitation of pathological changes in 9-month-old zebrafish livers. (A) Gene expression of il1? and tnf? (n = 6). (B) Masson?s staining and fibrosis score of zebrafish livers (n = 3). (C,D) The protein levels of ?-smooth muscle actin (?-SMA) (n = 8). *, p < 0.05, **, p < 0.01, ***, p < 0.001. Data represent the mean and error bars represent SEM. Scale bar, 20 ?m. NAFLD, non-alcoholic fatty liver disease; ND, normal diet; HFD, high fat diet; HEX, high-fat diet plus exercise. |
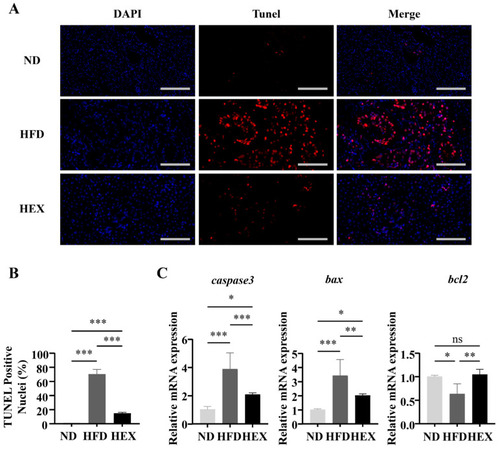
Hepatocyte apoptosis in 9-month-old zebrafish livers. (A) Tunel staining of zebrafish livers, and (B) Quantitation of Tunel-positive cells (n = 3). (C) Gene expression of caspase3, bax, and bcl2 (n = 6). *, p < 0.05 **, p < 0.01, ***, p < 0.001. Data represent the mean, and error bars represent SEM. Scale bar, 20 ?m. NAFLD, non-alcoholic fatty liver disease; ND, normal diet; HFD, high fat diet; HEX, high-fat diet plus exercise. |
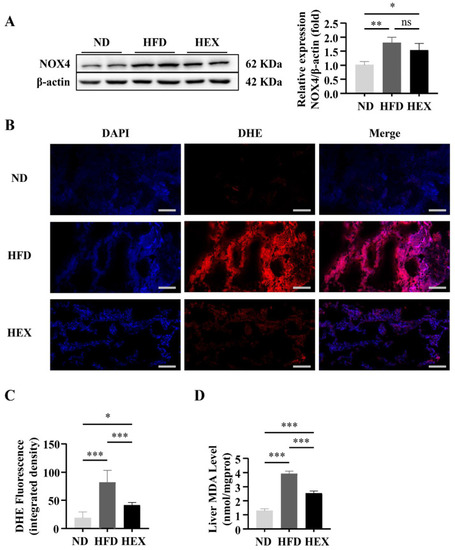
Oxidative stress in 9-month-old zebrafish livers. (A) NOX4 protein expression (n = 8). (B) Dihydroethidium (DHE) staining of zebrafish livers (n = 3), and (C) quantitation of DHE staining. (D) MDA levels in zebrafish livers (n = 5). *, p < 0.05, **, p < 0.01, ***, p < 0.001. Data represent the mean, and error bars represent SEM. Scale bar, 20 ?m. NAFLD, non-alcoholic fatty liver disease; ND, normal diet; HFD, high fat diet; HEX, high-fat diet plus exercise. |
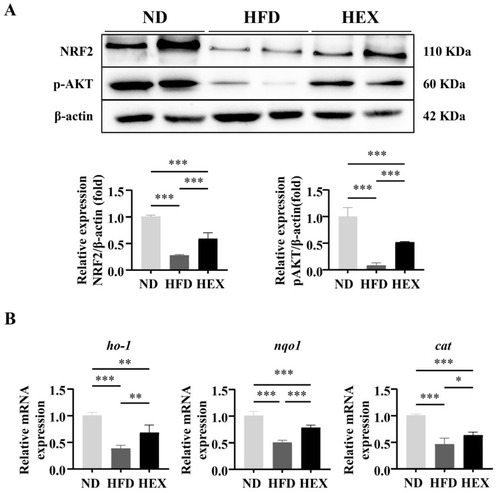
NRF2 signaling in 9-month-old zebrafish livers. (A) Western blot of p-AKT and NRF2 expression in zebrafish livers (n = 8). (B) Gene expression of ho-1, nqo1, and cat (n = 6). *, p < 0.05, **, p < 0.01, ***, p < 0.001. Data represent the mean, and error bars represent SEM. NAFLD, non-alcoholic fatty liver disease; ND, normal diet; HFD, high fat diet; HEX, high-fat diet plus exercise. |