
Image
|
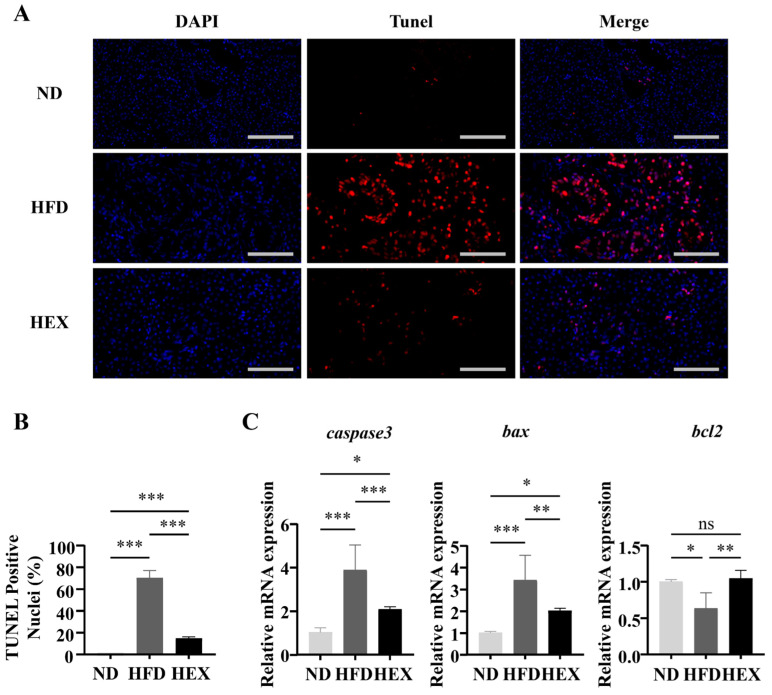
Figure Caption
Figure 5 Hepatocyte apoptosis in 9-month-old zebrafish livers. (A) Tunel staining of zebrafish livers, and (B) Quantitation of Tunel-positive cells (n = 3). (C) Gene expression of caspase3, bax, and bcl2 (n = 6). *, p < 0.05 **, p < 0.01, ***, p < 0.001. Data represent the mean, and error bars represent SEM. Scale bar, 20 μm. NAFLD, non-alcoholic fatty liver disease; ND, normal diet; HFD, high fat diet; HEX, high-fat diet plus exercise.
Acknowledgments
This image is the copyrighted work of the attributed author or publisher, and
ZFIN has permission only to display this image to its users.
Additional permissions should be obtained from the applicable author or publisher of the image.
Full text @ Int. J. Mol. Sci.